اطلاعیه

بستن

راهنمای فروم - حتما بخوانید

با سلام

قابل توجه کاربران محترم تالار گفتگو

قبل از ارسال پست یا ایجاد موضوع جدید، تاپیک قوانین و راهنمای فروم را مطالعه نمائید.

کاربران و مخصوصا تازه واردین لطفا دقت باشید که هرگونه پیشنهاد مدیریت سرمایه یا فروش تحلیل و یا برگزاری کلاس و ... که خارج از محیط عمومی فروم باشد را به هیچ عنوان بدون تحقیق و کسب اطلاعات کامل و کافی دنبال نکنید در غیر این صورت مسئولیت و عواقب آن بر عهده خود شخص می باشد.

همچنین لازم به ذکر است مسئولیت ارتباطات خارج از پست های عمومی فروم اعم از پیام خصوصی یا چت یا دیداری یا شنیداری با سایر اعضای فروم کاملا با خود اعضا هست و وارد کردن آن به صورت عمومی در فروم ممنوع است. برای امنیت بیشتر جهت گرفتن پاسخ سوالات خود از انجمنها استفاده نمایید.

دوستان توجه داشته باشند که تمامی بخش های اختصاصی و عمومی فروم کاملا رایگان بوده و به هیچ عنوان نیاز به پرداخت وجه به هیچ کس برای باز شدن دسترسی نیست.

منتها به این دلیل که در این بخش ها معمولا کار تیم ورک و گروهی انجام میشود، مناسب ورود افراد با شرایط خاصی است که مدیر آن بخش تعیین میکند و برای همه افراد کارایی ندارد چون مستلزم بر عهده گرفتن مسئولیت یا دانش کافی در آن حوزه می باشد.

لذا ضمن پوزش از کاربرانی که تقاضای دسترسی آن ها به بخش های اختصاصی توسط مدیران بخش رد میشود، توصیه میکنیم که پس از فراگیری موضوعات عمومی و تخصصی فراوانی که در روی فروم قرار دارد چنانچه برنامه ویژه ای برای کار در بخش های اختصاصی و کار گروهی دارند آن را مکتوب برای مدیران هر بخش بنویسند و سپس اقدام به درخواست دسترسی بکنند.


با احترام
مشاهده بیشتر
مشاهده کمتر

آخرین مطالب مفید و آموزشی از سایت های خارجی معتبر در زمینه آنلاین تردینگ

بستن
X
 
  • فیلتر کردن
  • زمان
  • نمایش
پاک کردن همه
پست های جدید

  • #31
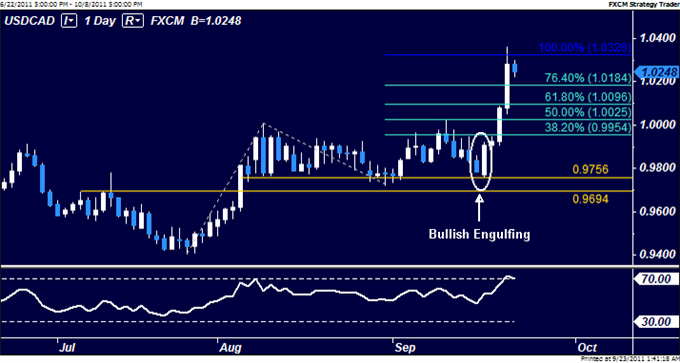
    USDCAD: Pullback to Offer Long Entry Point

    USDCAD put in a Bullish Engulfing candlestick pattern above range support at 0.9756 and launched aggressively higher, nudging the measured Fibonacci extension objective at 1.0326. RSI studies are now at their most overbought in over a year and we will look for a corrective pullback over the days ahead as an opportunity to enter long.
    سربلندوپیروزباشید.
    اولین و کارآمد ترین و موثر ترین روش جهت ورود به بازار ، ورود در بالای خطوط حمایت و در زیر خطوط مقاومت می باشد. این اولین ، مهمترین و پر کاربرد ترین درسی است که یک تریدر باید بیاموزد.

    نظر


    • #32
      Fibo

      Fibonacci Retracement

      The first thing you should know about the Fibonacci tool is that it works best when the market is trending.The idea is to go long (or buy) on a retracement at a Fibonacci support level when the market is trending up, and to go short (or sell) on a retracement at a Fibonacci resistance level when the market is trending down.In order to find these retracement levels, you have to find the recent significant Swing Highs and Swings Lows. Then, for downtrends, click on the Swing High and drag the cursor to the most recent Swing Low.

      For uptrends, do the opposite. Click on the Swing Low and drag the cursor to the most recent Swing High.Got that? Now, let's take a look at some examples on how to apply Fibonacci retracements levels in the markets.
      Uptrend

      This is a daily chart of AUD/USD.Here we plotted the Fibonacci retracement Levels by clicking on the Swing Low at .6955 on April 20 and dragging the cursor to the Swing High at .8264 on June 3. Tada! The software magically shows you the retracement levels.As you can see from the chart, the retracement levels were .7955 (23.6%), .7764 (38.2%), .7609 (50.0%), .7454 (61.8%), and .7263 (76.4%).Now, the expectation is that if AUD/USD retraces from the recent high, it will find support at one of those Fibonacci levels because traders will be placing buy orders at these levels as price pulls back.Now, let's look at what happened after the Swing High occurred.Price pulled back right through the 23.6% level and continued to shoot down over the next couple of weeks. It even tested the 38.2% level but was unable to close below it.Later on, around July 14, the market resumed its upward move and eventually broke through the swing high. Clearly, buying at the 38.2% Fibonacci level would have been a profitable long term trade!
      Downtrend

      Now, let's see how we would use the Fibonacci retracement tool during a downtrend. Below is a 4-hour chart of EUR/USD.As you can see, we found our Swing High at 1.4195 on January 26 and our Swing Low at 1.3854 a few days later on February 2. The retracement levels are 1.3933 (23.6%), 1.3983 (38.2%), 1.4023 (50.0%), 1.4064 (61.8%) and 1.4114 (76.4%).The expectation for a downtrend is that if price retraces from this low, it will encounter resistance at one of the Fibonacci levels because traders will be ready with sell orders there.Let's take a look at what happened next.Yowza, isn't that a thing of beauty?! The market did try to rally, stalled below the 38.2% level for a bit before testing the 50.0% level. If you had some orders either at the 38.2% or 50.0% levels, you would've made some mad pips on that trade.

      اولین و کارآمد ترین و موثر ترین روش جهت ورود به بازار ، ورود در بالای خطوط حمایت و در زیر خطوط مقاومت می باشد. این اولین ، مهمترین و پر کاربرد ترین درسی است که یک تریدر باید بیاموزد.

      نظر


      • #33
        Fibo-Combine with trendline

        Combining Fibs with Trend Lines

        Another good tool to combine with the Fibonacci tool is trend line analysis. After all, Fibonacci levels work best when the market is trending, so this makes a lot of sense!Remember that whenever a pair is in a downtrend or uptrend, traders use Fibonacci retracement levels as a way to get in on the trend. So why not look for levels where Fib levels line up right smack with the trend?Here's a 1-hour chart of AUD/JPY. As you can see, price has been respecting a short term rising trend line over the past couple of days.You think to yourself, "Hmm, that's a sweet uptrend right there. I wanna buy AUD/JPY, even if it's just for a short term trade. I think I'll buy once the pair hits the trend line again."Before you do that though, why don't you reach for your forex tool box and get that Fibonacci tool out? Let's see if we can get a more exact entry price.Here we plotted the Fibonacci retracement levels by using the Swing low at 82.61 and the Swing High at 83.84.Notice how the 50.0% and 61.8% Fib levels are intersected by the rising trend line.Could these levels serve as potential support levels? There's only one way to find out!Guess what? The 61.8% Fib level held, as price bounced there before heading back up. If you had set some orders at that level, you would have had a perfect entry!A couple of hours after touching the trend line, price zoomed up like Astroboy on Red Bull, bursting through the Swing High.


        اولین و کارآمد ترین و موثر ترین روش جهت ورود به بازار ، ورود در بالای خطوط حمایت و در زیر خطوط مقاومت می باشد. این اولین ، مهمترین و پر کاربرد ترین درسی است که یک تریدر باید بیاموزد.

        نظر


        • #34
          Fibo-Cobining With Support & Resistance

          Combining Fibs with Support and Resistance

          Like we said in the previous section, using Fibonacci levels can be very subjective. However, there are ways that you can help tilt the odds in your favor.
          While the Fibonacci tool is extremely useful, it shouldn't be used all by its lonesome self.
          It's kinda like comparing it to NBA superstar Kobe Bryant. Kobe is one of the greatest basketball players of all time, but even he couldn't win those titles by himself. He needs some backup.
          Similarly, the Fibonacci tool should be used in combination with other tools. In this section, let's take what you've learned so far and try to combine them to help us spot some sweet trade setups.
          Are y'all ready? Let's get this pip show on the road!
          One of the best ways to use the Fibonacci tool is to spot potential support and resistance levels and see if they line up with Fibonacci retracement levels.
          If Fib levels are already support and resistance levels, and you combine them with other price areas that a lot of other traders are watching, then the chances of price bouncing from those areas are much higher.
          Let's look at an example of how you can combine support and resistance levels with Fib levels. Below is a daily chart of USD/CHF.

          As you can see, it's been on an uptrend recently. Look at all those green candles! You decide that you want to get in on this long USD/CHF bandwagon.
          But the question is, "When do you enter?" You bust out the Fibonacci tool, using the low at 1.0132 on January 11 for the Swing Low and the high at 1.0899 on February 19 for the Swing High.
          Now your chart looks pretty sweet with all those Fib levels.

          Now that we have a framework to increase our probability of finding solid entry, we can answer the question "Where should you enter?"
          You look back a little bit and you see that the 1.0510 price was good resistance level in the past and it just happens to line up with the 50.0% Fib retracement level. Now that it's broken, it could turn into support and be a good place to buy.

          If you did set an order somewhere around the 50.0% Fib level, you'd be a pretty happy camper!
          There would have been some pretty tense moments, especially on the second test of the support level on April 1. Price tried to pierce through the support level, but failed to close below it. Eventually, the pair broke past the Swing High and resumed its uptrend.
          اولین و کارآمد ترین و موثر ترین روش جهت ورود به بازار ، ورود در بالای خطوط حمایت و در زیر خطوط مقاومت می باشد. این اولین ، مهمترین و پر کاربرد ترین درسی است که یک تریدر باید بیاموزد.

          نظر


          • #35
            Fibo Extension

            Fibonacci Extensions

            The next use of Fibonacci will be using them to find targets.Gotta always keep in mind "Zombieland Rules of Survival #22" - When in doubt, know your way out! Let's start with an example in an uptrend.In an uptrend, the general idea is to take profits on a long trade at a Fibonacci Price Extension Level. You determine the Fibonacci extension levels by using three mouse clicks.First, click on a significant Swing Low, then drag your cursor and click on the most recent Swing High. Finally, drag your cursor back down and click on any of the retracement levels.This will display each of the Price Extension Levels showing both the ratio and corresponding price levels. Pretty neat, huh?Let's go back to that example with the USD/CHF chart we showed you in the previous lesson.The 50.0% Fib level held strongly as support and, after three tests, the pair finally resumed its uptrend. In the chart above, you can even see price rise above the previous Swing High.Let's pop on the Fibonacci extension tool to see where would have been a good place to take off some profits.Here's a recap of what happened after the retracement Swing Low occurred:
            • Price rallied all the way to the 61.8% level, which lined up closely with the previous Swing High.
            • It fell back to the 38.2% level, where it found support
            • Price then rallied and found resistance at the 100% level.
            • A couple of days later, price rallied yet again before finding resistance at the 161.8% level.
            As you can see from the example, the 61.8%, 100% and 161.8% levels all would have been good places to take off some profits.
            Now, let's take a look at an example of using Fibonacci extension levels in a downtrend.
            In a downtrend, the general idea is to take profits on a short trade at a Fibonacci extension level since the market often finds support at these levels.
            Let's take another look at that downtrend on the 1-hour EUR/USD chart we showed you in the Fib Sticks lesson.

            Here, we saw a doji form just under the 61.8% Fib level. Price then reversed as sellers jumped back in, and brought price all the way back down to the Swing Low.
            Let's put up that Fib Extension tool to see where would have been some good places to take profits had we shorted at the 61.8% retracement level.

            Here's what happened after price reversed from the Fibonacci retracement level:
            • Price found support at the 38.2% level
            • The 50.0% level held as initial support, then became an area of interest
            • The 61.8% level also became an area of interest, before price shot down to test the previous Swing Low
            • If you look ahead, you'll find out that the 100% extension level also acted as support
            We could have taken off profits at the 38.2%, 50.0%, or 61.8% levels. All these levels acted as support, possibly because other traders were keeping an eye out for these levels for profit taking as well.
            The examples illustrate that price finds at least some temporary support or resistance at the Fibonacci extension levels - not always, but often enough to correctly adjust your position to take profits and manage your risk.
            Of course, there are some problems to deal with here.
            First, there is no way to know which exact Fibonacci extension level will provide resistance. Any of these levels may or may not act as support or resistance.
            Another problem is determining which Swing Low to start from in creating the Fibonacci extension levels.
            One way is from the last Swing Low as we did in the examples; another is from the lowest Swing Low of the past 30 bars. Again, the point is that there is no one right way to do it, but with a lot of practice, you'll make better decisions of picking Swing points.
            You will have to use your discretion in using the Fibonacci extension tool. You will have to judge how much longer the trend will continue. Later on, we will teach you methods to help you determine the strength of a trend.


            Read more: http://www.babypips.com/school/fibon...#ixzz1ZAfA8qCO

            اولین و کارآمد ترین و موثر ترین روش جهت ورود به بازار ، ورود در بالای خطوط حمایت و در زیر خطوط مقاومت می باشد. این اولین ، مهمترین و پر کاربرد ترین درسی است که یک تریدر باید بیاموزد.

            نظر


            • #36
              usd.cad

              Chart of the Day
              Loonie (CAD) Strengthens On Better Jobs Report!


              By Mike Conlon, ForexNews.com on Oct 7, 2011 0114 GMT
              [IMG][/IMG]


              The Canadian Dollar has strengthened this morning after a better than expected employment report showed that the Canadian economy added 60K jobs last month, almost 4 times more than the expected 15K jobs. This helped push the unemployment rate down to 7.1% from an expected 7.3% and shows signs that the economy north of the border may be quietly improving.


              One of the dynamics of the Canadian economy is that it is closely linked to the US economy as we are the largest importer of Canadian goods and services. The overall mood and feeling in the markets is that the US economy has been teetering near recession so this was seen as bad for Canada as well. However, this number shows that perhaps there is more life in both economies than had been previously thought.


              Should risk continue to abate in the marketplace, then we could envision a return to USD/CAD at 1.02.
              اولین و کارآمد ترین و موثر ترین روش جهت ورود به بازار ، ورود در بالای خطوط حمایت و در زیر خطوط مقاومت می باشد. این اولین ، مهمترین و پر کاربرد ترین درسی است که یک تریدر باید بیاموزد.

              نظر


              • #37
                gbp

                Pound (GBP) Tanks As BOE Increases QE!


                By Mike Conlon, ForexNews.com on Oct 6, 2011 0123 GMT


                [IMG][/IMG]
                The British pound has tanked this morning vs. all currencies as teh BOE announced that they were increasing the size of their asset purchases by 75 billion to 275 billion citing potential liquidy strains. This sent the Pound plummeting lower after it failed to breach the R1 daily pivot resistance as seen on the chart below.


                This extreme move crashed through both the S1 and S2 daily pivot supports and looks to have settled around 1.53. If risk should increase in the market due to the Euro debt crisis, tehn we could see further US dollar strength which could push the Pound even lower, perhaps to the 1.50 level. Stay tuned!
                اولین و کارآمد ترین و موثر ترین روش جهت ورود به بازار ، ورود در بالای خطوط حمایت و در زیر خطوط مقاومت می باشد. این اولین ، مهمترین و پر کاربرد ترین درسی است که یک تریدر باید بیاموزد.

                نظر


                • #38
                  Forex Market Outlook 10/07/11

                  Forex Market Outlook 10/07/11


                  By Mike Conlon, ForexNews.com on Oct 7, 2011 01:05:23 GMT


                  All eyes are on this month’s Non-Farm Payrolls report which is expected to show a gain of 60K, with a private sector gain of around 90K. Unemployment is expected to remain at 9.1%. While this is one of the most important data releases, the overall risk themes in the marketplace have held markets back. Economic data has been mildly weak of late, which I think is a positive given the risk environment.


                  One sign that we may see better numbers is the earlier employment report out of Canada, who reported a gain of 61K jobs vs. an expected 15K and the unemployment rate ticked down to 7.1% from 7.3%.


                  **Update** NFP has come in showing a gain of 103K jobs, better than the expected 60K estimate. Private sector jobs added was 137K, better than the 90K expected. Last month’s NFP was revised higher to show 57K jobs added vs. the reported 0. Unemployment rate remains steady at 9.1%.


                  The markets have used this opportunity to increase risk appetite, though today’s better than expected numbers may reduce the chance of QE3 from Bernanke and the Fed. While overall that would be a good thing, the markets may be slightly disappointed in that prospect.


                  There is an interesting dynamic taking place in the US economy and the “Wall St. Occupation” protests may be the sign that we have hit bottom. We know about the gridlock in Washington DC and the Euro debt crisis, but markets have been looking to move higher for some time. This may be a situation where the markets can no longer wait around for politicians to get their acts together so business may take the bull by the horns and run with it.


                  While this number does not change the economic malaise we are feeling overnight, it a step in the right direction. Should we get some sound economic policies here in the US, then we might actually see some improvement in confidence which in turn would help the economy recover. Not higher taxes, not more government spending, not more free Fed money. Confidence.


                  Meanwhile confidence has increased that Euro zone leaders may be getting it together as they are finally discussing the potential re-capitalization of banks. European bank exposure to sovereign debt is a major problem and the UK bank exposure was likely a reason that the BOE chose to increase QE to add further liquidity if the problems in the Europe got worse.


                  This prompted Moody’s to downgrade the UK banks (they’re always late to the party, aren’t they) and yet the Pound has rallied off of yesterday’s knee-jerk reaction the saw the Pound sell-off. As a mentioned yesterday, I thought the market got it wrong initially and indeed I was right. So risk appetite trumped QE in the UK and the markets are moving higher. PPI figures also came in slightly higher than expected showing signs that inflation is still a problem, but the BOE may be willing to deal with issue as the economy recovers.


                  Lost in the mix of what has been taking place in Europe, the Japanese interest rate decision came out last night to little fan-fare as it produced no change in policy. While this is exactly what was expected, there has been some hope that the BOJ might intervene in their currency as recent Yen strength could be extremely detrimental to Japanese exports and thus the economy. Last night’s meeting might seem like an obvious place to launch intervention, but my feeling is that the BOJ has been trying to do the unexpected. So if any intervention is coming, it would most likely occur on Sunday night when the Asian markets open.


                  Outside of this, the attention should return to the Euro debt crisis. There is hope that some sort of agreement can be reached within the next few weeks. While there is still risk in the markets, today’s report can give us hope that better times may be coming.
                  اولین و کارآمد ترین و موثر ترین روش جهت ورود به بازار ، ورود در بالای خطوط حمایت و در زیر خطوط مقاومت می باشد. این اولین ، مهمترین و پر کاربرد ترین درسی است که یک تریدر باید بیاموزد.

                  نظر


                  • #39
                    fh ja;v hcdd
                    .::در ترید آرامش حرف اول را می زند::.
                    https://telegram.me/Cyclicalwaves
                    https://telegram.me/NimaAzaadi


                    نظر


                    • #40
                      مدیریت سرمایه و روانشناسی بازار

                      برای ورود به هر بازار و حرفه ای مهم ترین انگیزه و دلیل برای اغلب افراد کسب درآمد می باشد حال آنکه شرایط گوناگون شخصی، اجتماعی و بازده درآمد می تواند در انتخاب مسیر و نوع کار یا سرمایه گذاری تاثیر گذار باشد.اگر بخواهیم بی پرده با اغلب کسانی که می خواهند وارد بورس های با فراریت بالا مانند(فارکس، طلا، نقره، نفت و غیره) صحبت داشته باشیم باید اذعان کنیم که شرایط ورودی و سرمایه گذاری در این بورس ها بسیار آسان می باشد و با توجه به ریسک موجود نیز بازده سرمایه میتواند تا ده ها و صد ها برابر باشد اما از یاد نبریم که ماهیت فرار و بازیگران زیاد این بورس ها باعث به وجود آمدن ضوابط خاص شده است که این ضوابط از قوه تشخیص بسیاری افراد پنهان می باشد. بیشتر از آن که در این بورس ها فرد در حال رقابت با بازیگران دیگر باشد در حال رقابت با خود و محک زدن دانش، تجربه و شرایط روحی روانی خویش در بورس می باشد. برای موفقیت در بورس های این چنینی سه عامل مهم در موفقیت فرد نقش دارد.
                      الف: دانش و تجربه
                      ب: مدیریت سرمایه
                      ج: نگرش و روانشناسی
                      در صورتی که سرمایه گذار هر یک از عوامل فوق را نادیده بگیرد و یا در اجرای اصول کوتاهی نماید مستقیما باعث زیان خود شده و قسمت قابل توجهی از سرمایه خود را از دست خواهد داد. تجربه نشان داده است افرادی که از دانش و تجربه کافی برخوردار نبوده و یا مدیریت ریسک و سرمایه را جدی نمی گیرند و افرادی که نگرش صحیحی به معاملات نداشته و بر خود تسلط کافی ندارند، سرمایه خود را در زمانی کوتاه از دست می دهند.
                      توجه داشته باشید که این بخش، قسمتی کوچک از کل دوره می باشد ولی با این وجود رعایت، تسلط و بکارگیری تمامی دستورات و پیشنهادهای این قسمت به طور مستقیم با ماندگاری و سودآوری سرمایه گذاری نسبت مستقیم دارد. بنابراین توجه و تمرکز فراوان شما نسبت به این قسمت را برای موفقیت امری واجب و ضروری می دانم.
                      شناسایی و استفاده از اصول احتمالات در معاملات

                      پیش بینی ریاضی، فرآیند بسیار مهمی در ترید است. شما میتوانید این علم رابه نفع خودتان بکار ببرید و یا اجازه دهید بازار از آن به نفع خویش استفاده کند.
                      همانطور که قبلا گفته شد برای موفقیت در بازار و کسب سود مداوم به سه عامل کلی نیاز داریم، نقش و اهمیت سه عامل بالا تا حدی می باشد که ایراد و نقصان در اجرای هر کدام از آنها منجر به از دست رفتن کل حساب خواهد شد. به عنوان مثال در صورتی که تریدر به دو عامل “دانش و تجربه” و “نگرش و روانشناسی” تسلط کافی داشته باشد ولی اصول مدیریت سرمایه را برای تعیین حجم معاملات در نظر نگیرد، پس از مدت کوتاهی سرمایه اش را از دست خواهد داد.
                      عامل دیگری که شانس کسب در آمد و افزایش حساب را برای معامله گران کمتر می کند میزان اسپرد و تفاوت نرخ خرید و فروش می باشد. اگر شما به صورت کاملا اتفاقی در بازی شیر یا خط شرکت کنید شانس پیروزی و بخت شما کاملا برابر و 50 درصد می باشد حال آنکه در بازار های مالی شما شانسی برابر 50 در صد ندارید و بابت هر معامله مبلغی را به عنوان کارمزد (اسپرد) به کارگزار خود می پردازید. در این صورت حتی اگر شانس موفقیت سیستم تحلیل و پیش بینی شما 50 در صد باشد باز هم در بلند مدت شما یازنده خواهید بود چرا که به مرور سرمایه شما تحلیل می رود. بنابراین باید سیستمی را پیدا کنید که شانس موفقیت تان را به بیش از 50 در صد برساند. مساله دیگر میزان سرمایه ای می باشد که بر اساس آن معامله می کنید. دوباره به مثال شیر یا خط بر میگردیم من 1 دلار و شما 10 دلار دارید با هر شیر من یک سنت برنده و با هر خط یک سنت می بازم در صورتی من کل پولم را از دست می دهم که شما 100 خط متوالی بیاورید و شما در صورتی می بازید که من 1000 خط متوالی بیاورم. در صورتی که بین ما کسی مانند بروکر کارمزد نگیرد!!! حال اگر هر شیر 25 سنت مرا برنده و هر خط 25 سنت مرا بازنده کند چه اتفاقی روی می دهد؟ بعد از چهار خط متوالی من سرمایه ام را از دست می دهم و بعد از 40 شیر متوالی شما سرمایه خود را از دست می دهید، شانس چهار احتمال متوالی بیشتر است یا 40 احتمال متوالی؟ کاملا معلوم است که احتمال از دست رفتن سرمایه من 10 برابر احتمال سرمایه شما می باشد. احتمالات این بازی در بازار فارکس کاملا عینیت دارد و در صورت استفاده از سرمایه کم یا لوریج بالا احتمال بازنده شدن و از دست رفتن سرمایه بسیار زیاد می باشد. برای این منظور غیر از تلاش برای افزایش شانس موفقیت در معاملات، با سرمایه زیاد یا لوریج کمی وارد بازار شوید تا احتمال بازنده شدن شما در مقابل بازار کاهش یابد.
                      آشنایی با Drawdown و اندازه گیری بازگشت از ضرر

                      Drawdown نشان دهنده حداکثر افت سرمایه از مقدار ماکزیمم می باشد و عموما به صورت درصد بیان می گردد. به عنوان مثال اگر یک معامله گر حساب 20000 دلاری داشته باشد و با ضرری معادل 5000 دلار، حساب خود را به 15000 دلار برساند 25 درصد drawdown را تجربه کرده است. نکته جالب توجه در مورد drowdown این است که اگر یک معامله گر درصدی ضرر کند، برای بازگشت به رقم اولیه باید درصدی بیش از آن مقدار را سود کند! اجازه بدهید مثالی بیاوریم: معامله گری 20000 دلار سرمایه دارد. 50 درصد سرمایه خود را ضرر می کند و سرمایه او به 10000 دلار می رسد. حال اگر وی بخواهد به رقم 20000 دلار اولیه برگردد، باید سرمایه فعلی خود را دو برابر کند. یعنی برای جبران 50 درصد ضرر، باید 100 درصد سود کند که این کار بسیار دشواری است.
                      به همین ترتیب اگر معامله گر 10 درصد drawdown داشته باشد، برای جبران آن باید 11.11 درصد سود کند…
                      جدول drawdown

                      به توجه به مطالب فوق، معامله گر باید توجه داشته باشد که “حفظ سرمایه و ضرر نکردن در اولویت قرار دارد”
                      شناسایی اصول استفاده از نسبت سود به ضرر

                      یکی از مهمترین اصول مدیریت ریسک و مدیریت سرمایه رعایت نسبت زیان به سود (Risk/Reward یا R/R) می باشد. قبل از انجام هر معامله شما باید بدانید سود احتمالی که از آن معامله توقع دارید چقدر است و برای به دست آوردن این مقدار سود حاضرید چه میزان از سرمایه خود را به خطر بیندازید. آیا منطقی است که برای به دست آوردن یک سود 1000 دلاری، 5000 دلار ریسک را بپذیریم؟ قطعا پاسخ منفی است. اصول مدیریت ریسک بیان می کند که در هر معامله، میزان ریسک حداکثر باید نصف سود مورد انتظار باشد. یعنی اگر برای یک معامله فرضا 30 پوینت استاپ لاس در نظر گرفته اید، حد اقل 60 پوینت یا بیشتر را باید به عنوان تارگت در نظر بگیرید. اگر فرصت معاملاتی پیش بیاید که نتوانیم این نسبت را برای آن به کار گیریم، توصیه اکید این است که کلا از آن معامله صرف نظر کنیم.
                      شناسایی اصول محاسبه حداکثر میزان ضرر بر اساس سرمایه

                      معمولا معامله گران مبتدی به دو صورت موجودی حسابشان را از بین می برند یا با نگذاشتن حد ضرر (استاپ لاس) و یا با معاملات زیان آور پشت سر هم.
                      در حالت اول برای افراد مبتدی حد ضرر مانند محافظی محکم جلوی از بین رفتن حساب را می گیرد اما آنها عموما با نگذاشتن حد ضرر اجازه می دهند ضررشان انباشته شود. شاید چندین معامله برایشان پیش بیاید که با نگذاشتن حد ضرر، معامله پس از مدتی وارد سود شود اما حتما پس از مدتی به دامی گرفتار می شوند که بازار بر خلاف جهت آنان حرکت می کند و موجب از بین رفتن کل سرمایه در یک معامله می شود.
                      حالت دوم در صورتی پیش می آید که معامله گر مدیریتی بر ضررهای خویش ندارد و اجازه می دهد ضررهای متوالی و بعضا بزرگ موجودی حسابش را از بین ببرند. برای پیش گیری از این حالت توصیه می شود در هیچ معامله واحدی، مقدار حد ضرر (استاپ لاس) بیش از 3 درصد کل موجودی سرمایه نگردد و در هیچ زمانی مجموع مقدار حد ضرر (استاپ لاس) معاملاتی که همزمان باز هستند بیش از 6 درصد موجودی حساب نباشد. به عنوان مثال برای حسابی 1000 دلاری حداکثر ریسک یک معامله در صورت رسیدن بازار به حد ضرر باید 30 دلار باشد و پیرو این قضیه تنظیم لات (حجم) معامله انجام شود و هیچ زمانی ریسک مجموع معاملات همین حساب نباید بیش از 60 دلار بشود. توصیه می شود معامله گران برای هر بازه زمانی خود حد ضرری خاص داشته باشند. به عنوان نمونه در صورت 6درصد زیان در روز یا 10 درصد زیان سرمایه در هفته از معاملات دست کشیده و علت زیان های خود را بر اساس روش معاملاتی خود و مدیریت سرمایه مورد بازبینی قرار دهند و پس از بررسی و رفع اشکالاتی که باعث به وجود آمدن معاملات زیان ده شده است فعالیت خود را از سر گیرند.
                      آشنایی با اشتباهات رایج معاملگران مبتدی

                      1- کمبود دانش: یکی از اصلی ترین دلایل معاملات زیان آور، کمبود یا نداشتن دانش و آگاهی لازم نسبت به شرایط و واقعیات بازار می باشد. معامله در بازار فارکس نیز مانند هر حرفه دیگر، نیازمند دانش و تجربه کافی است.
                      2- معاملات احساسی: این مورد آسیب رسان ترین دلیل برای از بین رفتن حساب می باشد. معاملاتی که برگرفته از برنامه و روش معاملاتی نیست با احساس تریدر سرو کار دارد و به علت اینکه برای این معاملات از تفکر و تعقل استفاده نشده عموما زیان آور هستند. احساسات گوناگونی می تواند در معاملات دخیل باشد اما یک نکته در تمام احساسات معامله گران یکسان است، تمامی معاملات احساسی منجر به ضرر میگردند. احساس غالب، در اکثر موارد طمع برای کسب سود بیشتر است. در حالی که جلوگیری از ضرر نکته مهم تری است. احساسات خود را بشناسید و در زمان ترید کردن تا حد امکان آنها را کنترل کنید.
                      3- معاملات زیاد: معاملات زیاد (over trading) معمولا به این دلیل انجام می شود که معامله گرتمایل دارد تمام حرکت های بازار را بدون کم و کاست شکار کند. این امر تقریبا محال است و بزرگترین تحلیل گران و معامله گران دنیا نیز این کار را انجام نمی دهند.
                      4- معامله با حجم زیاد: حجم زیاد معاملات، ریسک سرمایه گذار و آسیب پذیری سرمایه را افزایش می دهد. هنگامی که یک معامله گر با حجم بالا معامله می کند، با تعداد کمی معامله ضررده می تواند کل حساب خود را از دست بدهد.
                      5- اعتماد به پیش بینی دیگران: از معاملات دیگران برداشت و الگوبرداری نکنید، شرایط حساب، دیدگاه و دلایل افراد با یکدیگر برای حضور در بازار متفاوت است. هر کسی حتی در صورت استفاده از پیش بینی دیگران مسئول حساب خویش است ، مگر آنکه کل مدیریت حساب خویش را به تریدری دیگر بدهد. تا حد امکان از تحلیل خود پیروی کنید.
                      6- نداشتن حد ضرر (استاپ لاس): نداشتن استاپ لاس به معنی این است که معامله گر حدی برای اشتباه خویش متصور نیست، هر انسانی امکان اشتباه دارد و حد ضرر امکانی برای جلوگیری از فاجعه بار بودن اشتباهات می باشد. قبل از آغاز معامله حد ضرر خود را بشناسید. در زمان معامله اغلب معامله گران تحت تاثیر ترید خود قرار می گیرند و از لحاظ روانی برایشان سخت است که حد ضررشان را بپذیرند. در زمان معامله تغییر حد ضرر عموما منجر به زیان های بیشتر می شود. هیچ زمانی حد ضرر خود را خلاف جهت معامله خود تغییر ندهید. یعنی مقدار حد ضرر خود را بیشتر نکنید.
                      7- معامله در ساعات نامناسب: آشنایی نداشتن با میزان نوسان بازار در ساعات متفاوت هر جفت ارزی می تواند باعث تخمین های اشتباه معامله گران شود. ارزهای اروپایی در مقابل دلار، در ساعات بازار توکیو نوسانات زیادی ندارند و نباید برای معاملات در این ساعات سودهای زیادی متصور بود و یا در ساعات اولیه بازار لندن و نیویورک نباید نوسانات کوتاه و کوچک ما را از نوسانات بزرگی که بازار در پیش دارد غافل کند.
                      8- معامله یک ارز نه یک جفت ارز: ما در اصل ارزش برابری دو ارز را معامله می کنیم. با تحلیل صرف عوامل تکنیکال یا فاندامنتال یک کشور نمیتوان نتیجه گرفت که یک جفت ارز در چه جهتی حرکت خواهد کرد. شاید فاندامنتال و تکنیکال ارز مقابل، شرایط متفاوتی را برای برابری آن جفت ارز رغم زده باشد که نباید از دید معامله گر پنهان بماند.
                      9-نداشتن سیستم معاملاتی: نداشتن برنامه، روش یا سیستم معاملاتی از اصلی ترین دلایل زیان می باشد. نداشتن برنامه و روش عموما باعث معاملات احساسی می شود در حالی که روش معاملاتی به تریدر دیدگاهی برای تفسیر تمامی قیمت های بازار می دهد. شاید برنامه و روش مکانیزه و کامپیتری نباشد اما حتما باید وجود داشته باشد. برنامه باید قابلیت تفسیر بازار، بازدهی در گذشته و همخوانی با شرایط تریدر را داشته باشد. نقصان در هر کدام از این شرایط، باعث معیوب بودن برنامه و پیرو آن از دست رفتن بخش قابل توجهی از سرمایه می شود.
                      10- معامله خلاف روند: عموما بیشتر برنامه ها و روش های معاملاتی برای استفاده از جهت حرکت بازار استفاده می شوند. هم جهتی معاملات با روند اصلی، امکان سود بیشتر و ریسک کمتر را به همراه دارد. تا زمانی که برنامه و روش امتحان شده شما معاملات خلاف جهت را تایید نکرده است از معامله در خلاف روند اصلی بازار بپرهیزید.
                      11- خروج های بی برنامه (خروج از معاملات به خاطر ترس): معامله گر مبتدی عموما با سود و یا ضرر های کم، از ترس زیان های بیشتر از معامله خود خارج می شود و برنامه ای غیر از سیستم معاملاتی خود را در پیش می گیرد. در اغلب موارد پتانسیل سود خود را با سود کم یا زیان از دست می دهد و پس از حرکت بازار خود را نکوهش می کند که این امر می تواند عواقب منفی دیگری برای حساب داشته باشد.
                      12- معاملات با اهداف کوچک: کسانی که برای اهداف کوچک وارد می شوند حد ضرر و سود کوچکی در نظر می گیرند (اسکالپر ها) در اغلب موارد، حد ضررشان بیشتر از حد سودشان است و به این نکته توجه نمی کنند که بازار در کوتاه مدت، تحت تاثیر معاملات لحظه ای می تواند جهاتی خارج از جهت اصلی خود ایجاد کند و همین تغییر جهت کوچک می تواند موجب زیان آنها شود. معاملات با اهداف کوچک ریسک حد سود را نسبت به اسپرد افزایش می دهد. اگر یک معامله گر برای معامله ای 10 پیپ حد سود و حد ضرر را در نظر بگیرد با احتساب اسپرد، تنها با 7 پیپ حرکت بازار در خلاف جهت، ضرر می کند در حالی که برای رسیدن قیمت به حد سود، باید بازار 13 پیپ به نفع شما حرکت کند. به نظر شما کدام قیمت نزدیکتر است و به احتمال زیاد دیده خواهد شد؟
                      13- معامله در قله ها و دره ها: افرادی که برای استفاده از تمامی یک روند تلاش می کنند زیان های بسیاری را متحمل می شوند. افراد کمال طلب تنها به دنبال قله ها و دره ها هستند در حالی که قله ها و دره ها در بازارهای دو جهته نسبی بوده و هر زمانی امکان اینکه بازار دره ها و قله های جدیدی بسازد وجود دارد. این مساله را برای خود حل کنید که نمیتوان از تمام حرکات بازار استفاده کرد. شما اگر با رعایت اصول، قسمتی از حرکت مفید بازار را هم شکار کنید، در دراز مدت سود خوبی به دست می آورید.
                      14- ساده انگاری بیش از حد: اینکه روشهای ساده، اصولی و کاربردی عموما بازده خوبی دارند بر هیچ کس پوشیده نیست اما ساده انگاشتن بیش از حد معاملات، عموما منجر به زیان می گردد. باید توجه داشت بازار با شرایط و دلایل گوناگونی به حرکت در می آید. ساده انگاری و بی توجهی به عوامل تاثیر گذار بازار عموما موجب زیان می گردد. نسبت به آنها آگاه باشید.
                      15- معامله نزدیکی خبر: معامله در نزدیکی زمان اعلام اخبار مهم اقتصادی بیشتر مواقع برای ارضای احساس سود گرفتن می باشد. حرکات سریع و ناگهانی قیمت ها در زمان اعلام خبر می تواند هر تریدر آماتوری را وسوسه کند اما آیا نتیجه این معاملات برای وی قابل تصور است؟ در صورت نداشتن تجربه و اشراف کامل نسبت به خبر و موضوع آن، از معامله در زمانهایی که بازار تحت تاثیر خبر است اجتناب کنید.
                      16- اطمینان به روش اشتباه: بسیار دیده شده که معامله گران با سودهای کم تعداد و کوچک تحت تاثیر روشی قرار میگیرند و حتی در صورت زیان آور بودن، آن را تغییر نمی دهند یا بهینه نمی سازند. دائمابا خوشبینی بی مورد به خود امید واهی می دهند در حالی که روش یا کارایی خود را از دست داده یا حتی امتحانی کامل و درست پس نداده تا به نتیجه برسد. روش خود را بشناسید و در صورت مشکل داشتن یا آنرا بهینه کنید و یا کلا تغییر دهید.
                      17- نداشتن دستور توقف زیان (استاپ لاس) نزد کارگزار: تریدرهای مبتدی با توجیحات و دلایل گوناگون ممکن است دستور توقف زیان خود را برای کارگزارشان مشخص نکنند. شاید با رسیدن قیمت به نقطه زیان، ایشان ضرر را بپذیرند و به صورت دستی از معامله خارج شوند ولی حتما باید فکری هم برای حوادث ناگهانی کرد تا از زیانهای بزرگ جلوگیری شود. قطع دسترسی به بروکر (قطع اینترنت و تلفن) و حوادث ناگهانی تغییرات قیمتی می تواند باعث شود که شما بیش از مقداری که قبل از معامله پیش بینی کرده اید متضرر شود و در صورت بروز این اتفاق هیچ کسی پاسخ گوی شما نخواهد بود. همزمان با آغاز هر معامله دستور زیان خود را برای بروکر مشخص کنید. بدین صورت معامله خود را برای زیانهای بزرگ به نوعی بیمه کرده اید.
                      18- توجه نکردن به معاملات باز: توجه نکردن به معاملات و دستورات باز میتواند یکی از دلایل از بین رفتن سرمایه باشد. همه می دانیم ترید و تمرکز مداوم روی قیمتها امری کسالت آور و خسته کننده است اما غفلت و بی توجهی نیز میتواند عواقب بدی برای موجودی حساب داشته باشد. در صورت داشتن معاملات باز بر اساس روش خود شرایط بازار را زیر نظر بگیرید خود را درگیر معاملات متعدد نکنید چرا که با اینکار تمرکز را از بعضی از معاملات خود می گیرید. چه بسا آن معاملات سود بیشتری داشته اند یا امکانش بوده که در ضرر کمتر متوقفشان کرد. در صورتی که احساسات بر شما قالب نمی شوند از معاملات خود غافل نشوید و آنها را ترک نکنید.
                      19- تفسیر نادرست اخبار: تفسیر نادرست اخبار شاید نشات گرفته از کمبود دانش باشد اما موارد بسیاری نیز وجود دارد که دانش شما به حد کافی است اما تجربه عکس العمل بازار نسبت به آن خبر را ندارید. فرضیات شما برای خبر میتواند کاملا درست باشد اما نقش تجربه و بینش برای تفسیر خبرها بسیار مهمتر و حیاتی تر از دانش می باشد. تا زمانی که تجربه لازم روی اخبار ندارید از معامله بر اساس آنها اجتناب کنید.
                      20- سپردن معاملات به شانس: سپردن معاملات به اما و اگر برگرفته از رفتار قماربازان می باشد. معاملات خود را مدیریت کنید، برای بهبود آنها تلاش کنید و آنها را زیر نظر بگیرید. مطمئن باشید با شانس نمیتوان در بازار های مالی موفق شد. دانش، تجربه و مدیریت معاملات از مهم ترین عوامل موفقیت در معاملات می باشند. سرمایه خود را به بخت و اقبال نسپارید.
                      21- تاثیرپذیری از نوسانات قیمت: بسیار دیده شده معامله گران تحت تاثیر نوسانات، روش و برنامه خود را فراموش می کنند. این تفکر در زمانهایی که بازار حرکات شدیدتری دارد شیوع بیشتری پیدا می کند. افراد در این زمان ها با این تصور که “بازار حرکات شدیدی دارد. چرا من استفاده نکنم” از روش خود پیروی نکرده و ناخواسته موجب زیان حسابشان می شوند. تنها بعد از قبول ضرر است که فرد می فهمد که حرکتش کاملا اشتباه بوده است.
                      22- نداشتن شجاعت معامله: برخی افراد اساسا بیش از حد محافظه کار هستند. اغلب در زمانی که روششان سیگنال میدهد در مکان لازم وارد نمی شوند و مدام در پی بدست آوردن قیمت های بهتر هستند. شاید در گذشته معاملات زیان آور سختی را پشت سر گذاشته باشند که حال می ترسند. این افراد سعی می کنند مدت زیادی بازار را زیر نظر بگیرند اما در مکان لازم وارد معامله نمی شوند و تنها بعد از حرکت بازار در جهت دلخواهشان، افسوس گذشته را می خورند. تمایل بسیار زیاد به تحلیل بازار بدون گرفتن معامله از علامت های اصلی این افراد می باشد.
                      23- عدم تمرکز و زمان کافی: زمان و تمرکز از مهم ترین اصولی می باشد که آنقدر بدیهی است که بسیاری از آن غافل می شوند. اگر سیستم تحلیل و معامله شما بر مبنای این است که بعد از معامله آنرا زیر نظر بگیرید بنابراین لازم است قبل از آغاز معامله زمان مورد نیاز را محاسبه کنید. آیا می توانید برای آن معامله تا زمان مورد نیاز، بازار را زیر نظر بگیرید؟ بسیاری هم با اینکه می دانند نمی توانند زمان زیادی بازار را زیر نظر بگیرند سعی در این دارند در مدت کوتاهی نظر خود را بر بازار تحمیل کنند و بالاخره کاری انجام دهند. این افراد نیز به علت اینکه تمرکز کافی ندارند و در عین حال از روش همیشگیشان استفاده نمی کنند اسباب زیان خود را فراهم می کنند.
                      24- توجیه معاملات: توجیه معمولا زمانی بوجود می آید که معامله گر می داند که اشتباه میکند اما با فرضیات غلط، خود را برای انجام آن معامله یا روش اشتباه توجیه می کند. فرد توجیه کننده عموما عوامل اصلی را فراموش می کند و تنها خود را با عوامل فرعی متغیر فریب می دهد. در بسیاری موارد با خود عهد می بندد که همین یک بار اشتباهی را انجام دهد اما باز آن را تکرار می کند و معاملات معدودی را که با توجیه اشتباه به سود رسیده مدام به خاطر می آورد. توجیه و بهانه آوردن برای معاملات سود آور و زیان آور تنها یک نتیجه دارد و آن هم از بین رفتن حساب فرد است.
                      25- تعمیم اشتباه قیمت ها: این فرضیه که در بسیاری موارد قیمت بعضی کالا ها و ارزها با هم ارتباط نزدیکی دارند بر هیچ معامله گری پوشیده نیست اما این مساله نباید باعث بوجود آمدن فرضیات غلط بشود. با فرض اینکه میدانیم یورو به دلار و پوند به دلار حرکات شبیه به هم دارند، نمیتوان این نتیجه را گرفت که همیشه به مانند هم حرکت می کنند. این اشتباه که معامله گران مبتدی با تحلیل یکی از آنها بر روی جفت ارز دیگر معامله انجام می دهند میتواند فرضیه غلطی باشد. تعمیم نمودارها و قیمت ها به یکدیگر برای انجام معاملات کاری اشتباه است که تنها از معامله گران مبتدی سر میزند.
                      26- تحت تاثیر جهت قرار گرفتن: اولین و مهمترین کاری که یک تریدر انجام میدهد پیش بینی جهت آینده بازار است. شاید شما جهت را درست تشخیص بدهید اما به علت ورود در جای نامناسب معاملات زیان دهی انجام می دهید. تحت تاثیر جهت بازار قرار نگیرید اجازه بدهید روش و برنامه معاملاتی شما سیگنال ورود را صادر کنند نه جهت قیمت. یعنی ممکن است شما در جهت بازار وارد معامله شوید اما چون در جای مناسبی معامله خود را آغاز نکرده اید، متضرر شوید.
                      27- درگیر جزییات زیادی شدن: درگیر شدن با جزییات زیاد، تحلیل های گوناگون و استفاده از اندیکاتورهای بسیار، تنها باعث تشویش تریدر و بوجود آمدن سیگنالهای اشتباه می شود. از یک یا حداکثر دو روش استفاده کنید و برای تایید سیگنال های خود، از یکی دو اندیکاتور بیشتر استفاده نکنید و تا حد امکان سعی کنید چشم و گوش خود را روی سیستم ها و روش های دیگران ببندید. اگر روش شما سودآور بوده چه دلیلی دارد که به دنبال تایید گرفتن از دیگر روش ها باشید؟ مگر آنکه روش شما سود آور نباشد و به آن اطمینان نداشته باشید.
                      28- نپذیرفتن اشتباه: نپذیرفتن اشتباه تنها لجبازی با خود و از بین بردن حساب خویش است. تفاوتی ندارد که تریدر یک معامله اشتباه را نمی پذیرد و از آن درس نمی گیرد و یا کلا از یک سیستم معاملاتی اشتباه به طور مداوم استفاده می کند. بازار محل قدرت نمایی معامله گران نیست. هیچ زمانی بازار خود را با هیچ کس هماهنگ نمی کند. این تریدرها هستند که باید خود را با شرایط بازار هماهنگ کنند. اشتباهات خود را بشناسید، آنها را بپذیرید و از آنها درس بگیرید.اولین گام در راه موفقیت، شناسایی اشتباهات است.
                      29- کسی یک شبه پولدار نمی شود: تعریف شما از پولدار شدن چیست؟ اگر حسابتان را چند برابر کنید به خود پولدار می گویید؟ اینها سوالاتی است که عموما تریدرهای مبتدی جوابی برایشان ندارند. ایشان از یک سو رویاهای بسیار بزرگ دارند و از سوی دیگر راه رسیدن به آنها را نمی دانند. احتمال اینکه یک حساب ده هزار دلاری از بین برود یا به یک میلیون دلار برسد یک به صد است. بسیاری افراد این مساله را درک نمی کنند و با هر معامله به دنبال سود های آنچنانی هستند که امری محال است. این واقعیت که سرعت موفقیت در این بازار (فارکس) می تواند بیش از بازارهای دیگر باشد امری واضح است اما این سرعت به حدی نیست که با یک یا چند معامله میلیونر شوید. موفقیت پروسه ای است که زمان لازم دارد. برای موفقیت باید مجموع سودهای شما بیش از زیان های شما باشد. زمان لازم را به معاملات اختصاص دهید و مدام روشتان را تصحیح کنید.
                      30- ترس دیدن ضرر: ترس احساس طبیعی انسان است که او را از آسیب دیدن محافظت می کند. اما همین احساس اگر بیش از حد مجال یابد مانع پیشرفت و موفقیت می گردد. از اینکه معامله شما وارد ضرر شده نترسید مگر آنکه از سیستمتان پیروی نکرده باشید. زمانی که با برنامه و روش وارد معامله شده اید ترس عاملی بی معناست که تنها می تواند جلوی سودهای بیشتر شما را سد کند. با بازار منطقی برخورد کنید و تلاش کنید که قبل از انجام معامله، هنگام انجام معامله و بعد از آن احساسات بر تصمیم گیری شما تاثیر گذار نباشد.
                      31- در نظر نگرفتن نسبت ریسک به ریوارد: شما هیچ زمانی در تجارت بدون لوریج، حاضر به معامله کالایی که احتمال ضررش چند برابر امکان سودش است نمی شوید. اما زمانی که صحبت از لوریج می شود با هدف کسب سود بیشتر این ریسک را می پذیرید. انجام معامله ای که حد سود آن کمتر از حد ضررش است تنها استفاده از احتمالات علیه خویش است. سعی کنید به مبادلاتی مبادرت کنید که حد زیان به سودش، یک به یک ونیم یا بیشتر است.
                      32- فرضیات غلط: فرضیات غلط از مهمترین عوامل زیان ها هستند. بازارهای با فراریت زیاد (مانند فارکس) با اینکه از قوانین و فرضیات خاصی پیروی می کنند اما هیچ چیز در آنها ثابت و همیشگی نیست. اگر اتفاقی در گذشته روی داده هیچ تضمینی نیست که در آینده آن اتفاق یا عکس آن حتما روی دهد. بازار ترکیب و تلفیقی از اتفاقات گذشته و حال است. برای خود فرضیه بافی نکنید. از روش و سیستم معاملات خود پیروی کنید. تناقضات بازار را بشناسید و از فرضیاتی که اثبات نشده اند یا متزلزل هستند پیروی نکنید.
                      33- تاثیر شایعات: شایعات با اینکه مواقعی موتور متحرک بازار هستند اما زمان های بسیاری وجود دارد که بازار از شایعات پیروی نمی کند از شایعات دوری کنید حتی اگر هر از گاهی درست باشند. سعی کنید از واقعیات بازار فرضیه بسازید. برداشت های خود را با واقعیات بازار تطبیق دهید و سپس وارد بازار شوید. به این شکل حتی اگر متضرر شوید نگرانی چندانی ندارید چون شما کاری را که درست بوده انجام داده اید.
                      34- فریب سرعت بازار: حرکت شدید بازار در یک جهت، تضمین کننده ادامه حرکت در آن جهت نیست. این مساله در اغلب بازارهای مالی مشاهده می شود و باعث زیان بسیاری از مبتدی ها می گردد. اگر پیش بینی کرده اید که بازار در دو روز آینده به هدف سود شما می رسد و بازار در عرض چند ساعت به قیمت مورد نظر رسید هیچ تضمینی وجود ندارد که با همان سرعت یا در همان جهت ادامه مسیر دهد. سعی کنید در سود و ضرری که پیش بینی کرده اید از بازار خارج شوید وسرعت بازار شما را فریب ندهد. اغلب روندهایی که مدت های طولانی دوام میاورند، در نمودار قیمت شیبی بین 45 تا 55 دارند. گرچه باز هم یادآوری می شود که شما باید در قیمت خروجی که قبل از آغاز معامله برای خود در نظر گرفته اید از بازار خارج شوید.
                      35- انتقام: انتقام احساسی است که بعد از هر شکست سراغ هر انسانی می آید. معاملات زیان آور خود را شکست تعبیر نکنید. بدون تحلیل و از روی احساس سعی در پس گرفتن پول از دست رفته خود نداشته باشید. تنها معامله گران مبتدی بعد از شکست (قطعی یا در جریان) برای جبران زیان به حجم معامله خود می افزایند. اگر زیان کردید آنرا بپذیرید. سعی کنید دلیل آنرا بیابید. حداقل تا ساعاتی بعد از ضرر از معامله پرهیز کنید و در معامله جدید حجم آنرا افزایش ندهید.
                      36- نداشتن استراحت: هر از گاهی به خود استراحت بدهید. کار کردن پیوسته انسان را خسته و دلزده میکند. نمی گویم بازار را زیر نظر نداشته باشید اما گهگاهی از بازار فاصله بگیرید و پس از استراحت، دوباره شرایط را بررسی کنید. حتی برای معاملات خود نیز استراحت را فراموش نکنید. اگر سیستم شما بصورتی است که نیاز به زیر نظر گرفتن بازار دارد در مواقع خستگی از کامپیوتر خود فاصله بگیرید. ساعاتی را که فکر می کنید بازار حرکات چندانی ندارد به استراحت بپردازید و بعد به بازار برگردید. برای کسب درآمد سلامتی خود را به خطر نیندازید. ذهن شما مهمترین ابزار حضور شما در بازار است با استراحت راندمان و بازده کاری آنرا بالا ببرید.
                      37- رویا پردازی: یکی از اشتباهات رایج معامله گران مبتدی را رعایت نکردن ریسک به ریوارد (زیان به سود) دانستیم اما نقطه مقابلی نیز برای این اشتباه وجود دارد: معامله گرانی که حد سود به ضررشان بیش از حد رویا پردازانه است. آنها با انتخاب حد ضرر های کوچک در پی سودهای بیش از حد بزرگ هستند. ریسک به ریوارد آنها اغلب از یک به چهار فراتر است. عموما آنقدر معاملات در سود فرو رفته خود را نمی بندند که یا آن معاملات در برگشت با صفر بسته شوند و یا در ضرر فرو روند. آنقدر ضررهای کوچک را می پذیرند تا زمانی که متوجه می شوند سرمایه ای برای سود های بزرگ و بلند مدت ندارند.
                      38- اعتماد به نفس کاذب: حتما تا به حال با افرادی مواجه شدید که چون چندین بار کاری را به درستی انجام داده اند فکر می کنند همیشه شرایط بر وفق مراد ایشان است. تصور می کنند بازار در دستان آنها است و فریب سود های گذشته را خورده و پل شکست خویش را می سازند. بازار اگر در جهت آنها حرکت نکند با آن لجبازی می کنند یا از بازار و معامله خود عصبانی می شوند اما هیچ فکر معقولی برای خروج از بحران نمی یابند. راه حل این افراد اجتناب از اعتماد به نفس کاذب است. هر میزان و هرچه معامله سودآور داشتید در زمان حال به فراموشی بسپارید و تنها تلاش کنید در مقابل معاملات حال حاضرتان بهترین و معقول ترین تصمیم را بگیرید.
                      39- عدم آرامش: آرامش از مهمترین و بدیهی ترین عوامل ترید است. زمانی که مشکل یا مساله ای در زندگی خصوصی دارید ترید نکنید. اصلا به بازار نزدیک نشوید. بازار مکانی برای برون رفت از احساسات منفی شما نیست. چه بسا با تحمل ضرر احساسات منفی شما تشدید شود همانطور که همیشه توصیه شده احساس غرور و سرخوردگی ناشی از سود و زیان شما را از حالت تعادل خارج نکند. باید بتوانید احساسات خارج از بازار را نیز در زمان ترید کنترل کنید.
                      40- استفاده از ابزارهای دارای تاخیر: استفاده از ابزارهای دارای تاخیر مخصوصا در استفاده از روش های تکنیکال و فاندامنتال می تواند عواقب وحشتناکی برای حساب شما داشته باشد. هر عامل تاثیر گذار غالبا در لحظه و خیلی زود تاثیر خود را روی قیمت در بازار نشان می دهد. بنابراین اگر از ابزاری استفاده کنیم که بعد از یک بازه زمانی اخطار خرید یا فروش را اعلام نماید به هیچ وجه منطقی نمی باشد. مهم ترین این ابزارهای دارای تاخیر ایندیکاتورهای لگینگ (Lagging) هستند.
                      41- عدم یادداشت برداری از معاملات: در صورتی که واقعا به موفقیت و رسیدن به اهداف در بازار ایمان دارید حتما از معاملات خود یاد داشت برداری نمایید. با این کار فرد از تکرار اشتباهات جلوگیری کرده و عوامل موفقیت خود را بیش از پیش شناسایی می نماید. مکتوب کردن تمامی عوامل مهم از دیدگاه یک معامله گر در کنار یادداشت احساسات در زمان معامله، روشی کمّی برای مشاهده آماری کیفیت ترید شما می باشد.
                      42- نداشتن راهنما: راهنما کسی است که شما را از اشتباهاتتان آگاه می کند و راه درست را به شما نشان می دهد. دیگر معاملات احساسی انجام نمی دهید چون باید به راهنمای خود توضیح دهید. امیدوارم درک کنید راهنما بازار را برای شما پیش بینی نمی کند، او به شما فورکست نمی دهد بلکه تنها شما را از اشتباهات بر حذر می دارد. نیازی نیست راهنما حتما یک تریدر باشد. آشنایی مختصر با فارکس هم کافیست گرچه اگر راهنمای شما معامله گری با تجربه باشد بهتر است. راهنما باید از همه شرایط شما و حسابتان آگاه باشد و متعهد باشد که هیچ اطلاعاتی از زندگی خصوصی شما به دیگران نمی دهد. راهنما تاثیر فوق العاده ای در پیش گیری از اشتباهات و تصحیح آنها دارد. برای خود راهنمایی امین بیابید.
                      جمع بندی : مراحل اصولی انجام یک معامله

                      آن چه درباره مدیریت سرمایه و روانشاسی معاملات تا به اینجا گفته شد قسمتی از اعمال و مجاسباتی می باشد که باید مد نظر قرار دهیم. برای عملی کردن اطلاعات بالا در قسمت انتهایی این بخش، نمونه عملی و قدم های لازم برای مدیریت سرمایه را یادآوری می کنیم. فراموش نشود که این قدم ها باید مو به مو اجرا شود و تخطی از قسمتی از آن مساویست با از دست دادن سرمایه. برای مدیریت سرمایه این قسمت را یا کامل مطابق دستورات اجرا کنید و یا به روش خود بازگردید.
                      1- تحلیل بازار: بر مبنای سیستم خود بازار را تحلیل کنید جهت آنرا تشخیص دهید و آماده معامله بشوید. اگر سیستم شما سیگنالی نمی دهد از وارد شدن به بازار بپرهیزید.
                      2- تشخیص نقطه خروج: حد ضرر و سود خود را قبل از آغاز معامله تایین کنید. تایین حد ضرر و سودتان باید بر اساس تحلیل و سیستم معاملاتی شما باشد نه عوامل دیگر. اگر سیستم و روش شما حد سود و زیانتان را مشخص نکرده از وارد شدن به بازار بپرهیزید.
                      3- ریسک به ریوارد:بعد از آنکه سیستم معاملاتی شما نقاط خروج را برای شما مشخص نمود، ببینید که آیا ریسک به ریوارد شما منطقی است یا خیر. اگر نسبت زیان به سود در قالبی که گفته شد نمی گنجد، بهتر است از از انجام معامله پرهیز کنید.
                      4- محاسبه سه درصد زیان: محاسبه کنید سه درصد زیان از کل حسابتان چه مقدار می شود. اگر می خواهید بیش از سه درصد پول خود را روی یک معامله ریسک کنید از ورود به بازار بپرهیزید.
                      5-ارزش هر پوینت زیان- سه درصد پول(دلار) حسابتان را بر میزان پوینت هایی که برای حد ضررتان در نظر گرفته اید تقسیم کنید به این صورت مشخص می شود هر پوینت ضرر شما چه میزان ضرر به شما تحمیل می کند.
                      اگر این محاسبات را بی ارزش می دانید تا زمانی که آنها را محاسبه نکرده اید از ورود به بازار بپرهیزید.
                      6- محاسبه مارجین برای هر پوینت- حال که فهمیدید اگر بازار در خلاف پیش بینی شما برود هر پوینت آن چه میزان ضرر برای شما به همراه دارد ارزش هر پوینت زیان را در 100 ضرب کنید.(یا میزان مارجین برای یک پوینت استاندارد آن جفت ارز را محاسبه کنید و سپس با نسبت بندی مارجین و لوریج ارزش هر پوینت ورودی را به دست آورید) مارجین درگیر پوزیشن شما باید به این میزان باشد.
                      اگر تمایل به استفاده مارجین بیشتر از محاسبات دارید به خاطر متضرر نشدن از ورود به بازار بپرهیزید.
                      7- مارجین کراس ریت ها- برای ارزهایی که طرف دوم آنها دلار است به محاسبات این قسمت نیازی نیست اما اگر ارز طرف دوم دلار نیست باید مارجین بدست آمده قسمت قبل را در نرخ برابری لحظه ای آن ارز نسبت به دلار ضرب کنید تا مارجین آن معامله بدست بیاید.
                      اگر 7 قانون مدیریت سرمایه بالا را رعایت کرده اید دیگر دلیلی برای تعلل وجود ندارد از معامله خود لذت ببرید. وارد بازار شوید و نگرانی از بابت مدیریت سرمایه نداشته باشید در بدترین حالت شما سه درصد زیان می کنید که در آینده قابل جبران است.
                      منبع:سودآوران

                      اولین و کارآمد ترین و موثر ترین روش جهت ورود به بازار ، ورود در بالای خطوط حمایت و در زیر خطوط مقاومت می باشد. این اولین ، مهمترین و پر کاربرد ترین درسی است که یک تریدر باید بیاموزد.

                      نظر


                      • #41
                        Market Correlations

                        11 Fascinating Market Correlations You'll Want to Use
                        by Jim Wyckoff
                        Experienced futures traders know there are many correlations among futures markets—some of which are valuable guides in helping to determine specific market trends, and some of which are fickle. This educational feature will examine some basic correlations among futures markets, and will likely be most beneficial to the less-experienced traders. However, it just might be a good refresher for

                        the experienced traders who may have forgotten a few of the market correlations.It is important to emphasize that market correlations are never 100% predictable, and that some market correlations can and do make 180-degree turns over a period of time.U.S. Dollar-Gold: The gold market and the dollar usually trade in an inverse relationship. This has been the case for many years. During times of U.S. economic prosperity and lower inflation, the dollar will usually benefit as money flows into U.S. paper assets (stocks and bonds), while physical assets (gold) are usually less attractive. Conversely, during times of weaker U.S. economic growth, higher inflation or heightened world economic or political uncertainty, traders and investors will tend to flock out of “paper” assets and into “hard” assets such as gold. Inflation is a bullish phenomenon for gold.U.S. Dollar-U.S. Treasury Bonds: Usually, a stronger dollar means a stronger bond market because of good demand for U.S. dollars (from overseas investors) to buy U.S. T-Bonds. T-Bonds are also seen as a “flight-to-quality” asset during times of economic or political instability. In the past, the U.S. dollar has also benefited from “flight-to-quality” asset moves. However, since the major terrorist attacks on the U.S. and the resulting damage to the U.S. economy, the safe-haven status of the “greenback” has been much less pronounced.Crude Oil-U.S. Treasury Bonds: If crude oil prices rally strongly, that is a negative for U.S. T-Bond prices, due to notions that inflationary pressures could reignite and become problematic for the economy. Inflation is the arch enemy of the bond market. Rising crude oil prices are also bullish for the gold market.CRB-U.S. Treasury Bonds: The CRB Index is a basket of commodities melded into one composite price. A rising CRB index means generally rising commodities prices, and increasing inflation. Thus, a rising CRB Index is negative for U.S. Treasury Bond prices.U.S. Stock Indexes-U.S. Treasury Bonds: Since the bull market in U.S. stocks ended just over two years ago, stock index futures prices and U.S. Treasury bond futures prices have traded in an inverse relationship. When stock prices are up, bond prices are usually down. However, during the long bull market run that preceded the current bear market, stock and bond prices traded in tandem. In fact, years ago, before all the electronic overnight futures trading had begun, the best way to get a good read on how the stock indexes would open was by early trading in the T-bond market. (T-Bond trading opens 70 minutes before the stock indexes).Silver-Soybeans: This corollary may be more fiction than fact, at least nowadays. But during the “go-go” days of soaring precious metals and soybean prices, it was said that if soybean futures would lock limit-up, bean traders would buy silver futures.Cattle-Hogs: The point to mention here is that if strong price gains or losses occur in one meat futures complex, there is likely to be somewhat of a spillover effect in the other meat complex. For example, sharp losses in the cattle or feeder cattle futures will likely weigh on the hogs and pork bellies.Currency Futures-U.S. Dollar Index: Most major IMM currency futures contracts are “crossed” against the U.S. dollar. Thus, when the majority of the currencies are trading higher, it’s very likely that the U.S. Dollar Index will be trading lower. It’s a good idea for currency traders to keep a watchful eye on the U.S. Dollar Index, as it’s the best barometer for the overall health of the U.S. dollar versus major foreign currencies.U.S. Stock Indexes-Lumber: Lumber is a very important commodity for the U.S. economy. It is literally a building block for the nation. If the stock market is sharply higher, lumber futures prices will be supported. A big sell off in the stock market will likely find selling pressure on lumber futures.N.Y. Cocoa-British Pound: London cocoa futures trading is as important (or even more important) than New York cocoa futures trading, on a worldwide basis. London cocoa futures trading is conducted in the British pound currency. Thus, big fluctuations in the pound sterling will impact the price of U.S. cocoa futures, due to the cross-currency fluctuations of the British pound versus the U.S. dollar. Keep in mind there is constantly arbitrage taking place between the New York and London cocoa markets, and thus the currency cross-rates between the pound and the dollar are very important.Grains-U.S. Dollar Index: A weaker U.S. dollar will be an underlying positive for the U.S. grain futures markets because it makes U.S. grain exports more competitive (cheaper prices) on the world market. Larger-degree trends in the U.S. dollar will have a larger-degree impact on the grains.

                        اولین و کارآمد ترین و موثر ترین روش جهت ورود به بازار ، ورود در بالای خطوط حمایت و در زیر خطوط مقاومت می باشد. این اولین ، مهمترین و پر کاربرد ترین درسی است که یک تریدر باید بیاموزد.

                        نظر


                        • #42
                          ABC Correction

                          ABC Correction

                          The 5-wave trends are then corrected and reversed by 3-wave countertrends. Letters are used instead of numbers to track the correction. Check out this example of a smokin' hot corrective 3-wave pattern!
                          <center style="margin-top: 0px; margin-right: 0px; margin-bottom: 0px; margin-left: 0px; padding-top: 0px; padding-right: 0px; padding-bottom: 0px; padding-left: 0px; border-top-style: none; border-right-style: none; border-bottom-style: none; border-left-style: none; border-width: initial; border-color: initial; outline-style: none; outline-width: initial; outline-color: initial; "></center>Just because we've been using a bull market as my primary example doesn't mean the Elliott Wave Theory doesn't work on bear markets. The same 5-3 wave pattern can look like this:
                          <center style="margin-top: 0px; margin-right: 0px; margin-bottom: 0px; margin-left: 0px; padding-top: 0px; padding-right: 0px; padding-bottom: 0px; padding-left: 0px; border-top-style: none; border-right-style: none; border-bottom-style: none; border-left-style: none; border-width: initial; border-color: initial; outline-style: none; outline-width: initial; outline-color: initial; "></center>Types of Corrective Wave Patterns

                          According to Elliott, there are 21 corrective ABC patterns ranging from simple to complex.
                          "Uh 21? I can't memorize all of that! The basics of the Elliott Wave Theory are already mind-blowing!"
                          Take it easy, young padawan. The great thing about Elliott Wave is you don't have to be above the legal drinking age to trade it! You don't have to get a fake ID or memorize all 21 types of corrective ABC patterns because they are just made up of three very simple easy-to-understand formations.


                          Let's take a look at these three formations. The examples below apply to uptrends, but you can just invert them if you're dealing with a downtrend.
                          The Zig-Zag Formation

                          <center style="margin-top: 0px; margin-right: 0px; margin-bottom: 0px; margin-left: 0px; padding-top: 0px; padding-right: 0px; padding-bottom: 0px; padding-left: 0px; border-top-style: none; border-right-style: none; border-bottom-style: none; border-left-style: none; border-width: initial; border-color: initial; outline-style: none; outline-width: initial; outline-color: initial; "></center>Zig-zag formations are very steep moves in price that goes against the predominant trend. Wave B is typically shortest in length compared to Waves A and C. These zig-zag patterns can happen twice or even thrice in a correction (2 to 3 zig-zag patterns linked together). Like with all waves, each of the waves in zig-zag patterns could be broken up into 5-wave patterns.
                          The Flat Formation

                          <center style="margin-top: 0px; margin-right: 0px; margin-bottom: 0px; margin-left: 0px; padding-top: 0px; padding-right: 0px; padding-bottom: 0px; padding-left: 0px; border-top-style: none; border-right-style: none; border-bottom-style: none; border-left-style: none; border-width: initial; border-color: initial; outline-style: none; outline-width: initial; outline-color: initial; "></center>Flat formations are simple sideways corrective waves. In flats, the lengths of the waves are GENERALLY equal in length, with wave B reversing wave A's move and wave C undoing wave B's move. We say generally because wave B can sometimes go beyond the beginning of wave A.
                          The Triangle Formation

                          <center style="margin-top: 0px; margin-right: 0px; margin-bottom: 0px; margin-left: 0px; padding-top: 0px; padding-right: 0px; padding-bottom: 0px; padding-left: 0px; border-top-style: none; border-right-style: none; border-bottom-style: none; border-left-style: none; border-width: initial; border-color: initial; outline-style: none; outline-width: initial; outline-color: initial; "></center>Triangle formations are corrective patterns that are bound by either converging or diverging trend lines. Triangles are made up of 5-waves that move against the trend in a sideways fashion. These triangles can be symmetrical, descending, ascending, or expanding.
                          Drop by our forums if you want to see the bullish and bearish versions of these Elliott Wave patterns.


                          Read more: http://www.babypips.com/school/abc-c...#ixzz1dywRxdif
                          اولین و کارآمد ترین و موثر ترین روش جهت ورود به بازار ، ورود در بالای خطوط حمایت و در زیر خطوط مقاومت می باشد. این اولین ، مهمترین و پر کاربرد ترین درسی است که یک تریدر باید بیاموزد.

                          نظر


                          • #43
                            The 5 - 3 Wave Patterns

                            Mr. Elliott showed that a trending market moves in what he calls a 5-3 wave pattern.
                            The first 5-wave pattern is called impulse waves.
                            The last 3-wave pattern is called corrective waves.
                            In this pattern, Waves 1, 3, 5 are motive, meaning they go along with the overall trend, while Waves 2 and 4 are corrective.
                            Do not confuse Waves 2 and 4 with the ABC corrective pattern (discussed in the next section) though!
                            Let's first take a look at the 5-wave impulse pattern. It's easier if you see it as a picture:
                            <center style="margin-top: 0px; margin-right: 0px; margin-bottom: 0px; margin-left: 0px; padding-top: 0px; padding-right: 0px; padding-bottom: 0px; padding-left: 0px; border-top-style: none; border-right-style: none; border-bottom-style: none; border-left-style: none; border-width: initial; border-color: initial; outline-style: none; outline-width: initial; outline-color: initial; "></center>That still looks kind of confusing. Let's splash some color on this bad boy.
                            <center style="margin-top: 0px; margin-right: 0px; margin-bottom: 0px; margin-left: 0px; padding-top: 0px; padding-right: 0px; padding-bottom: 0px; padding-left: 0px; border-top-style: none; border-right-style: none; border-bottom-style: none; border-left-style: none; border-width: initial; border-color: initial; outline-style: none; outline-width: initial; outline-color: initial; "></center>Ah magnifico! It's so pretty! We like colors, so we've color-coded each wave along with its wave count.
                            Here is a short description of what happens during each wave.
                            We're going to use stocks for our example since stocks are what Mr. Elliott used but it really doesn't matter what it is. It can easily be currencies, bonds, gold, oil, or Tickle Me Elmo dolls. The important thing is the Elliott Wave Theory can also be applied to the foreign exchange market.
                            Wave 1

                            The stock makes its initial move upwards. This is usually caused by a relatively small number of people that all of the sudden (for a variety of reasons, real or imagined) feel that the price of the stock is cheap so it's a perfect time to buy. This causes the price to rise.Wave 2

                            At this point, enough people who were in the original wave consider the stock overvalued and take profits. This causes the stock to go down. However, the stock will not make it to its previous lows before the stock is considered a bargain again.Wave 3

                            This is usually the longest and strongest wave. The stock has caught the attention of the mass public. More people find out about the stock and want to buy it. This causes the stock's price to go higher and higher. This wave usually exceeds the high created at the end of wave 1.Wave 4

                            Traders take profits because the stock is considered expensive again. This wave tends to be weak because there are usually more people that are still bullish on the stock and are waiting to "buy on the dips."Wave 5

                            This is the point that most people get on the stock and is most driven by hysteria. You usually start seeing the CEO of the company on the front page of major magazines as the Person of the Year. Traders and investors start coming up with ridiculous reasons to buy the stock and try to choke you when you disagree with them. This is when the stock becomes the most overpriced. Contrarians start shorting the stock which starts the ABC pattern.Extended Impulse Waves

                            One thing that you also need to know about the Elliott Wave Theory is that one of the three impulse waves (1, 3, or 5) will always be "extended". Simply put, there will always be one wave that is longer than the other two, regardless of degree.
                            According to Elliott, it is usually the fifth wave which is extended. As time went by, this old school style of wave labeling has changed because more and more people started labeling the third wave as the extended one.
                            Check out this forum thread for more Elliott Wave diagrams.


                            Read more:
                            http://www.babypips.com/school/the-5...#ixzz1dywl2DBA
                            اولین و کارآمد ترین و موثر ترین روش جهت ورود به بازار ، ورود در بالای خطوط حمایت و در زیر خطوط مقاومت می باشد. این اولین ، مهمترین و پر کاربرد ترین درسی است که یک تریدر باید بیاموزد.

                            نظر


                            • #44
                              Ichimoku-ابر ایچیموکو

                              Quick Description

                              Ichimoku Kinko Hyo is a purpose-built trend trading charting system that has been successfully used in nearly every tradeable market. It is unique in many ways, but its primary strength is its use of multiple data points to give the trader a deeper, more comprehensive view into price action. This deeper view, and the fact that Ichimoku is a very visual system, enables the trader to quickly discern and filter "at a glance" the low-probability trading setups from those of higher probability.
                              History

                              The charting system of Ichimoku Kinko Hyo was developed by a Japanese newspaper man named Goichi Hosoda. He began developing this system before World War II with the help of numerous students that he hired to run through the optimum formulas and scenarios - analogous to how we would use computer simulated backtesting today to test a trading system. The system itself was finally released to the public in 1968, after more than twenty years of testing, when Mr. Hosoda published his book which included the final version of the system.
                              Ichimoku Kinko Hyo has been used extensively in Asian trading rooms since Hosoda published his book and has been used successfully to trade currencies, commodities, futures, and stocks. Even with such wild popularity in Asia, Ichimoku did not make its appearance in the West until the 1990s and then, due to the utter lack of information in English on how to use it, it was mostly relegated to the category of another "exotic" indicator by the general trading public. Only now, in the early 21st century, are western traders really beginning to understand the power of this charting system.
                              Equilibrium At a Glance

                              The name Ichimoku Kinko Hyo, which translates to "Equilibrium chart at a glance" aptly describes the system and how it is to be used, as described below:
                              • While Ichimoku utilizes five separate lines or components, they are not to be used individually, in isolation, when making trading decisions, but rather used together to form an integrated "whole" picture of price action that can be gleaned "at a glance". Thus, a simple look at an Ichimoku chart should provide the Ichimoku practitioner with a nearly immediate understanding of sentiment, momentum and strength of trend.
                              • Price action is constantly measured or gauged from the perspective of whether it is in relative equilibrium or disequilibrium. Hosoda strongly believed that the market was a direct reflection of human group dynamics or behavior. He felt that human behavior could be described in terms of a constant cyclical movement both away from and back towards equilibrium in their lives and interactions. Each of the five components that make up Ichimoku provide its own reflection of this equilibrium or balance.
                              Ichimoku Components

                              The Ichimoku chart is composed of five (5) separate indicator lines. These lines work together to form the complete "Ichimoku picture". A summary of how each line is calculated is outlined below:

                              TENKAN SEN ("turning line") (HIGHEST HIGH + LOWEST LOW)/2 for the past 9 periodsLearn more</pre>
                              KIJUN SEN ("standard line") (HIGHEST HIGH + LOWEST LOW)/2 for the past 26 periodsLearn more</pre>
                              CHIKOU SPAN ("lagging line") CURRENT CLOSING PRICE time-shifted backwards (into the past) 26 periodsLearn more</pre>
                              SENKOU SPAN A ("1st leading line")(TENKAN SEN + KIJUN SEN)/2 time-shifted forwards (into the future) 26 periodsLearn more</pre>
                              SENKOU SPAN B ("2nd leading line")(HIGHEST HIGH + LOWEST LOW)/2 for the past 52 periods time-shifted forwards (into the future) 26 periodsLearn more</pre>The senkou span A and B deserve special mention here as they, together, form the Ichimoku "kumo" or cloud. We cover the kumo and its myriad functions in more detail in the section "The kumo".
                              The chart below (FIGURE I) provides a visual representation of each of these five components:
                              FIGURE I - Ichimoku Components

                              Ichimoku Settings

                              As you can see in the Ichimoku Components section above, each line calculation has one and sometimes two different settings based on the number of periods considered. After much research and backtesting, Goichi Hosoda finally determined that the settings of 9, 26 and 52 were the ideal settings for obtaining optimum results with Ichimoku. He derived the number 26 from what was then the standard Japanese business month (which included Saturdays). The number 9 represents a week and a half and the number 52 represents two months.

                              The standard settings for an Ichimoku Kinko Hyo chart are 9,26,52.</pre>There is some debate around whether or not these settings of 9,26,52 are still valid given that the standard work month here in the West does not include Saturdays. In addition, in non-centralized markets that do not keep standard business hours like the Forex (which trades around the clock) some have posited that there may be more appropriate settings. Nevertheless, we at Boersma & Hunt, as well as most other professional Ichimoku traders, agree that the standard settings of 9,26,52 work extremely well and do not need to be altered.

                              The argument could be made that, since Ichimoku Kinko Hyo functions as a finely-tuned, integrated whole, changing the settings to something other than the standard could throw the system out of balance and introduce invalid signals.</pre>Thus, for the purposes of describing Ichimoku Kinko Hyo within this wiki, it will be assumed that the standard settings are being used.
                              اولین و کارآمد ترین و موثر ترین روش جهت ورود به بازار ، ورود در بالای خطوط حمایت و در زیر خطوط مقاومت می باشد. این اولین ، مهمترین و پر کاربرد ترین درسی است که یک تریدر باید بیاموزد.

                              نظر


                              • #45
                                part 2-ichimoku

                                Ichimoku is a finely-tuned, integrated charting system where the five lines all work in concert to produce the end result. We emphasize the word "system" here because it is absolutely key to understanding how to use the various trading strategies we outline in this section. Every strategy covered below is to be used and measured against the prevailing Ichimoku "picture" rather than in isolation. This means that, while a scenario that matches a given strategy may have transpired, you still must weigh that signal against the rest of the chart in order to determine whether or not it offers a high-probability trade. Another way of looking at it is that Ichimoku is a system and the discrete strategies for trading it are merely "sub-systems" within that larger system. Thus, looking at trading any of these strategies from an automated or isolated approach that doesn't take into account the rest of what the Ichimoku chart is telling you will meet with mixed long-term success, at best.
                                Don't misinterpret the message; the strategies outlined below are very powerful and can bring consistent results if used wisely - which is within the scope of the larger Ichimoku picture. We ask that you always keep this in mind when employing these strategies.
                                If you are interested in discussing these trading strategies in more detail with both the authors and other Ichimoku traders, please visit the Kumo Trader Ichimoku Forum.
                                Tenkan Sen/Kijun Sen Cross

                                The tenkan sen/kijun sen cross is one of the most traditional trading strategies within the Ichimoku Kinko Hyo system. The signal for this strategy is given when the tenkan sen crosses over the kijun sen. If the tenkan sen crosses above the kijun sen, then it is a bullish signal. Likewise, if the tenkan sen crosses below the kijun sen, then that is a bearish signal. Like all strategies within the Ichimoku system, the tenkan sen/kijun sen cross needs to be viewed in terms of the bigger Ichimoku picture before making any trading decisions, as this will give the strategy the best chances of success.
                                In general, the tenkan sen/kijun sen strategy can be classified into three (3) major classifications: strong, neutral and weak.

                                STRONG TENKAN SEN/KIJUN SEN CROSS SIGNALA strong tenkan sen/kijun sen cross Buy signal takes place when a bullish cross happens above the kumo. A strong tenkan sen/kijun sen cross Sell signal takes place when a bearish cross happens below the kumo. </pre>
                                NEUTRAL TENKAN SEN/KIJUN SEN CROSS SIGNALA neutral tenkan sen/kijun sen cross Buy signal takes place when a bullish cross happens within the kumo. A neutral tenkan sen/kijun sen cross Sell signal takes place when a bearish cross happens within the kumo.</pre>
                                WEAK TENKAN SEN/KIJUN SEN CROSS SIGNALA weak tenkan sen/kijun sen cross Buy signal takes place when a bullish cross happens below the kumo. A weak tenkan sen/kijun sen cross Sell signal takes place when a bearish cross happens above the kumo. </pre>See the chart in Figure I below for an example of several classifications of the tenkan sen/kijun sen cross:
                                FIGURE I - Tenkan Sen/Kijun Sen Cross Classifications


                                But wait! Have you checked the chikou span?
                                With these three major classifications in mind, we will add something else into the equation - the chikou span. As we explained in the section detailing thechikou span, this component acts as a "final arbiter" of sentiment and should be consulted with every single trading signal in the Ichimiku Kinko Hyo charting system. The tenkan sen/kijun sen cross is no different. Each of the three classifications of the TS/KS cross mentioned above can be further classified based on the chikou span's location in relation to the price curve at the time of the cross. If the cross is a "Buy" signal and the chikou span is above the price curve at that point in time, this will add greater strength to that buy signal. Likewise, if the cross is a "Sell" signal and the chikou span is below the price curve at that point in time, this will provide additional confirmation to that signal. If the chikou span's location in relation to the price curve is the opposite of the TS/KS cross's sentiment, then that will weaken the signal.
                                Entry

                                The entry for the tenkan sen/kijun sen cross is very straightforward - an order is placed in the direction of the cross once the cross has been solidified by a close. Nevertheless, in accordance with good Ichimoku trading practices, the trader should bear in mind any significant levels of support/resistance near the cross and consider getting a close above those levels before executing their order.
                                Exit

                                The exit from a tenkan sen/kijun sen cross will vary with the particular circumstances of the chart. The most traditional exit signal is a tenkan sen/kijun sen cross in the opposite direction of your trade. However, personal risk management and time frame concerns may dictate an earlier exit, or an exit based upon other Ichimoku signals, just as in any other trade.
                                Stop-Loss Placement

                                The tenkan sen/kijun sen strategy does not dictate use of any particular Ichimoku structure for stop-loss placement, like some other strategies do. Instead, the trader should consider their execution time frame and their money management rules and then look for the appropriate prevailing structure for setting their stop-loss.
                                Take Profit Targets

                                Take profit targetting for the tenkan sen/kijun sen cross strategy can be approached in one of two different ways. It can be approached from a day/swing trader perspective where take profit targets are set using key levels, or from a position trader perspective, where the trader does not set specific targets but rather waits for the current trend to be invalidated by a tenkan sen/kijun sen cross transpiring in the opposite direction of their trade.
                                Case Study

                                In the 4H chart in Figure II below we can see a bullish tenkan sen/kijun sen cross at point A. Since this cross took place within the kumo itself, it is considered a "neutral" buy signal, thus we wait for price to exit and close above the kumo to confirm this sentiment before placing our long entry. Price does achieve a close above the kumo at point B (1.5918) and we place our long entry at that point. For our stop-loss, we look for the place where our trade sentiment would be invalidated. In this case, the bottom edge of the kumo provides us with just that at point C (1.5872).
                                Once we place our entry and stop-loss orders, we merely wait for the trade to unfold while keeping an eye out for potential exit signals. Price rises nicely for the next 10 to 11 days and then, on the 15th day of the trade, price drops enough to have the tenkan sen cross below the kijun sen at point D. This is our exit signal, since Ichimoku is telling us that the sentiment has changed, so we close our order at 1.6014 at point E for a total gain of over 95 pips.
                                FIGURE II - Tenkan Sen/Kijun Sen Cross Case Study

                                For maximum risk management on this trade, we also could have moved our stop-loss up with price once price was a conservative distance away from our entry. One option for doing this would be to move the stop-loss up with the kumo, keeping it just below the bottom edge. For even tighter risk management, we could have moved our stop-loss with the kijun sen, keeping it 5 to 10 pips below that line as it moved up.
                                Kijun Sen Cross

                                The kijun sen cross is one of the most powerful and reliable trading strategies within the Ichimoku Kinko Hyo system. It can be used on nearly all time frames with excellent results, though it will be somewhat less reliable on the lower, daytrading time frames due to the increased volatility on those time frames. The kijun sen cross signal is given when price crosses over the kijun sen. If it crosses the price curve from the bottom up, then it is a bullish signal. If it crosses from the top down, then it is a bearish signal. Nevertheless, like all trading strategies within the Ichimoku Kinko Hyo system, the kijun sen cross signal needs to be evaluated against the larger Ichimoku "picture" before committing to any trade.
                                In general, the kijun sen cross strategy can be classified into three (3) major classifications: strong, neutral and weak.

                                STRONG KIJUN SEN CROSS SIGNALA strong kijun sen cross Buy signal takes place when a bullish cross happens above the kumo. A strong kijun sen cross Sell signal takes place when a bearish cross happens below the kumo. </pre>
                                NEUTRAL KIJUN SEN CROSS SIGNALA neutral kijun sen cross Buy signal takes place when a bullish cross happens within the kumo. A neutral kijun sen cross Sell signal takes place when a bearish cross happens within the kumo.</pre>
                                WEAK KIJUN SEN CROSS SIGNALA weak kijun sen cross Buy signal takes place when a bullish cross happens below the kumo. A weak kijun sen cross Sell signal takes place when a bearish cross happens above the kumo.</pre>See the chart in Figure III below for an example of several classifications of the kijun sen cross:
                                FIGURE III - Kijun Sen Cross Classifications

                                Chikou span confirmation
                                As with the tenkan sen/kijun sen cross strategy, the savvy Ichimoku trader will make good use of the chikou span to confirm any kijun sen cross signal. Each of the three classifications of the kijun sen cross outlined above can be further classified based on the chikou span's location in relation to the price curve at the time of the cross. If the cross is a "Buy" signal and the chikou span is above the price curve at that point in time, this will add greater strength to that buy signal. Likewise, if the cross is a "Sell" signal and the chikou span is below the price curve at that point in time, this will provide additional confirmation to that signal. If the chikou span's location in relation to the price curve is the opposite of the kijun sen cross's sentiment, then that will weaken the signal.
                                Entry

                                The entry for the kijun sen cross is very straightforward - an order is placed in the direction of the cross once the cross has been solidified by a close. Nevertheless, in accordance with good Ichimoku trading practices, the trader should bear in mind any significant levels of support/resistance near the cross and consider getting a close above those levels before executing their order.
                                Exit

                                A trader exits a kijun sen cross trade upon their stop-loss getting triggered when price crossing the kijun sen in the opposite direction of their trade. Thus, it is key that the trader move their stop-loss in lockstep with the movement of the kijun sen in order to maximize their profit.
                                Stop-Loss Placement

                                The kijun sen cross strategy is unique among Ichimoku strategies in that the trader's stop-loss is determined and managed by the kijun sen itself. This is due to the kijun sen's strong representation of price equilibrium, which makes it an excellent determinant of sentiment. Thus, if price retraces back below the kijun sen after executing a bullish kijun sen cross, then that is a good indication that insufficient momentum is present to further the nascent bullish sentiment.
                                When entering a trade upon a kijun sen cross, the trader will review the current value of the kijun sen and place their stop-loss 5 to 10 pips on the opposite side of the kijun sen that their entry is placed on. The exact number of pips for the stop-loss "buffer" above/below the kijun sen will depend upon the dynamics of the pair and price's historical behavior vis-a-vis the kijun sen as well as the risk tolerance of the individual trader, but 5 to 10 pips should be appropriate for most situations. When looking to enter Short, the trader will look to place their stop-loss just above the current kijun sen and when looking to enter Long, the trader will place their stop-loss just below the current kijun sen.
                                Once the trade is underway, the trader should move their stop-loss up/down with the movement of the kijun sen, always maintaining the 5 to 10 pip "buffer". In this way, the kijun sen itself acts as a "trailing stop-loss" of sorts and enables the trader to keep a tight hold on risk management while maximizing profits.
                                Take Profit Targets

                                Take profit targetting for the kijun sen cross strategy can be approached in one of two different ways. It can be approached from a day/swing trader perspective where take profit targets are set using key levels, or from a position trader perspective, where the trader does not set specific targets but rather waits for the current trend to be invalidated by price crossing back over the kijun sen in the opposite direction of their trade.
                                Case Study

                                In the 1D chart in Figure IV below for USD/CHF we can see a bullish kijun sen cross at point A. While the initial cross is above the kumo and therefore a relatively strong cross, it is still beneath a very key chikou span level (not visible on this chart), so we wait until we get a close above that key level before entering at point B. At this point, we also have the additional benefit of confirmation from a bullish tenkan sen/kijun sen cross and a nice upward angle to the kijun sen, bolstering our prospects for more bullish price action even more. For our stop-loss, we follow the kijun sen trading strategy guidelines and place it 10 pips below the prevailing kijun sen at point C.
                                Once we place our entry and stop-loss orders, we merely wait for the trade to unfold while continually moving up our stop-loss with the kijun sen. Price rises nicely for the next 40 days staying well above the kijun sen. After this point, price begins to drop and, on the 44th day, price crosses the kijun sen and hits our stop-loss at point D closing out our trade and netting us a profit of 641 pips.
                                FIGURE IV - Kijun Sen Cross Case Study

                                Kumo Breakout

                                Kumo Breakout trading or "Kumo Trading" is a trading strategy that can be used on multiple time frames, though it is most widely used on the higher time frames (e.g.: Daily, Weekly, Monthly) of the position trader. Kumo breakout trading is the purest form of trend trading offered by the Ichimoku charting system, as it looks solely to the kumo and price's relationship to it for its signals. It is "big picture" trading that focuses only on whether price is trading above or below the prevailing kumo. In a nutshell, the signal to go long in Kumo breakout trading is when price closes above the prevailing kumo and, likewise, the signal to go short is when price closes below the prevailing kumo.
                                See the chart in Figure V below for an example of a kumo breakout buy signal:
                                FIGURE V - Kumo Breakout Buy Signal

                                Entry

                                The entry for the kumo breakout trading strategy is simple - when price closes above/below the kumo, the trader places a trade in the direction of the breakout. Nevertheless, care does need to be taken to ensure the breakout is not a "head fake" which can be especially prevalent when the breakout takes place from a flat top/bottom kumo. To ensure the flat top/bottom is not going to attract price back to the kumo, it is always advisable to look for another Ichimoku structure to "anchor" your entry to just above/below the kumo breakout. This anchor can be anything from a key level provided by the chikou span, a kumo shadow or any other appropriate structure that could act as additional support/resistance to solidify the direction and momentum of the trade.
                                Kumo breakout traders also make good use of the leading kumo's sentiment before committing to a trade. If the leading kumo is a Bear kumo and the kumo breakout is also Bear, then that is a very good sign that the breakout is not an aberration of excessive volatility, but rather a true indication of market sentiment. If the leading kumo contradicts the direction of the breakout, then the trader may want to either wait until the kumo does agree with the direction of the trade or use more conservative position sizing to account for the increased risk.
                                Exit

                                The exit from a kumo breakout trade is the easiest part of the whole trade. The trader merely waits for their stop-loss to get triggered as price exits the opposite side of the kumo on which the trade is transpiring. Since the trader has been steadily moving their stop-loss up with the kumo during the entire lifespan of the trade, this assures they maximize their profit and minimize their risk.
                                Stop-Loss Placement

                                Being a "big picture" trend trading strategy, the stop-loss for the kumo breakout strategy is placed at the point that the trend has been invalidated. Thus, the stop-loss for a kumo breakout trade must be placed on the opposite side of the kumo that the trade is transpiring on, 10 - 20 pips away from the kumo boundary. If price does manage to reach the point of the stop-loss, the trader can be relatively assured that a major trend change has taken place.
                                Take Profit Targets

                                While traditional take profit targets can be used with the kumo breakout trading strategy, it is more in-line with the long-term trend trading approach to simply move the stop-loss up/down with the kumo as it matures. This method allows the trade to take full advantage of the trend without closing the trade until price action dictates unequivocally that the trend is over.
                                Case Study

                                In the Weekly chart in Figure VI below for AUD/USD we can see a bearish kumo breakout taking place at point A. We also see that that leading kumo is distinctly bearish as well, which acts to confirm our breakout sentiment. Given that price is exiting from a flat-bottom kumo and that we want to reduce any risks of entering on a false breakout, we look for a close below the last chikou span support at .7600 before entering. The close we are looking for is achieved shortly thereafter at point B and we enter short.
                                For our stop-loss, we follow the kumo breakout guideline of placing it 10 - 20 pips away from the opposite side of the kumo where our breakout is taking place. In this case, we place it 20 pips away from the top of the kumo above our entry candle at point C (.7994).
                                Once we place our entry and stop-loss orders, we merely wait for the trade to unfold while continually moving our stop-loss down with the prevailing kumo. Given that we are using the Weekly chart as our execution time frame, we prepare ourselves for a very long-term trade. In this case, nearly two years later, price rises enough to break out of the kumo to the other side, where it triggers our buy order some 20 pips away at point D netting us over 1100 pips in the process.
                                FIGURE VI - Kumo Breakout Case Study

                                Senkou Span Cross

                                The senkou span cross is one of the lesser known trading strategies within the Ichimoku Kinko Hyo system. This is mostly due to the fact that the senkou span cross tends to be more commonly used as an additional confirmation with other trading strategies rather than being used as a standalone trading strategy in its own right. However, it is nonetheless a solid trend trading strategy and can definitely be used on its own.
                                Given that the senkou span cross strategy, like the kumo breakout trading strategy, utilize the kumo for signal generation, it is best employed on the longer time frames of the Daily chart and above. The senkou span cross signal is given when the senkou span A line crosses over the senkou span B line of the kumo. If the senkou span A crosses the senkou span B from the bottom up, then it is a bullish signal. If it crosses from the top down, then it is a bearish signal. Nevertheless, like all trading strategies within the Ichimoku Kinko Hyo system, the senkou span cross signal needs to be evaluated against the larger Ichimoku "picture" before committing to any trade.
                                The thing to keep in mind with the senkou span cross strategy is that the "cross" signal will take place 26 periods ahead of the price action as the kumo is time-shifted 26 periods into the future. This relationship is obvious when one looks at the current price on a live chart, but less so when looking at historical price action. In addition, while all Ichimoku strategies should be exercised with the larger Ichimoku picture in mind, this is particularly important with the senkou span cross. Thus, determining the overall trend on higher time frames first and then taking only senkou span signals that align with that trend on the lower timeframes is the best implementation of the senkou span strategy.
                                In general, the senkou span cross strategy can be classified into three (3) major classifications: strong, neutral and weak.

                                STRONG SENKOU SPAN CROSS SIGNALA strong senkou span cross signal takes place when the price curve is on the side of the kumo that matches the sentiment of the senkou span cross.</pre>
                                NEUTRAL SENKOU SPAN CROSS SIGNALA neutral senkou span cross signal takes place when the price curve is inside the kumo at the time of the senkou span cross.</pre>
                                WEAK SENKOU SPAN CROSS SIGNALA weak senkou span cross signal takes place when the price curve is on the opposite side of the kumo that matches the sentiment of the senkou span cross.</pre>The chart in Figure VII below shows some classifications of the senkou span cross. The dashed vertical lines represent the 26-period relationship between price and the senkou span cross. Thus, point A represents a bullish senkou span cross that can be categorized as a "strong" buy signal due to the fact that price (point B), at the point of the cross, was trading above the kumo. Likewise, point C represents a bearish senkou span cross that generated a strong sell signal due to price's location at point D below the kumo. The senkou span cross at Point E generated a neutral buy signal since price (point F) was trading within the kumo at that point.
                                FIGURE VII - Senkou Span Cross Classifications

                                Entry

                                The entry for the senkou span cross trading strategy is relatively simple, though, as mentioned above, entries do require even more attention to the overall trend on higher time frames before executing any trades. After determining the trend on the higher time frames, the trader looks for a fresh senkou span cross in the same direction as the overall trend that has been solidified by a close on the execution time frame. Once they identify a suitable opportunity, they initiate a position in the direction of the senkou span sentiment. As in all Ichimoku trading strategies, traders will be well-advised to consider the relative strength of the cross (vis-a-vis price's location relative to the kumo) as well as the sentiment provided by the remaining Ichimoku components at the time of the cross in order to ensure the most optimum entry.
                                It is worth mentioning here that the strong bull (buy) signal outlined in our first chart that took place in April of 2005, while technically strong from a 1D perspective, was not aligned with the overall downtrend in-place on the Weekly and Monthly charts. Thus, traders taking this trade signal and using a senkou span cross in the opposite direction as their exit signal would have actually lost pips. This underscores the importance of evaluating sentiment on multiple time frames and trading with the overall trend.
                                Exit

                                The exit from a senkou span cross trade is generally signalled by a senkou span cross in the opposite direction of the trade, though other exit signals may be taken depending upon the trader's risk tolerance and profit goals.
                                Stop-Loss Placement

                                Being a "big picture" trend trading strategy like the kumo breakout strategy, the stop-loss for the senkou span cross strategy is placed on the opposite side of the kumo that the trade is transpiring on, 10 - 20 pips away from the kumo boundary.
                                Take Profit Targets

                                While traditional take profit targets can be used with the senkou span cross trading strategy, it is more in-line with the long-term trend trading approach to wait for a senkou span cross to transpire in the opposite direction of the trade before closing out the position. This method allows the trade to take full advantage of the trend without closing the trade until price action dictates unequivocally that the trend is over.
                                Case Study

                                In the Daily chart in Figure VIII below for USD/CAD we can see a bearish senkou span cross at point A. This cross corresponds to the candle at point B. Since the candle closed just below the kumo, the signal is considered a strong one given that its sentiment agrees with the sentiment of the bearish senkou span cross. In addition, we confirm that the direction of this signal is aligned with the overall downtrend in-place on the Weekly and Monthly time frames, so we know that we are trading with the trend. Nevertheless, we are wary of the flat bottom kumo just to the right of the candle, which could act as an attractor for price, so we look for a conservative entry point that will ensure we will not get caught in any false breakouts. The last chikou span support at 1.2292 looks like a good anchor point for assuring this. Price closes below this point a couple of days later at 1.2290 and we enter short at point C.
                                For our stop-loss, we follow the kumo breakout guideline of placing it 10 - 20 pips away from the opposite side of the kumo where our trade is taking place. In this case, we place it 20 pips away from the top of the kumo above our entry candle at point D (1.2542).
                                Once we place our entry and stop-loss orders, we wait for the trade to unfold while continually moving our stop-loss down with the prevailing kumo. In this case, a bit more than four months later, price ranging has created a fresh senkou span cross in the opposite direction of our trade at point E, corresponding to the candle at point F where we close out our trade at 1.1908, netting us over 380 pips in the process.
                                FIGURE VIII - Senkou Span Cross Case Study

                                Chikou Span Cross

                                For those that have been using the Ichimoku Kinko Hyo charting system for any length of time, utilizing the chikou span cross strategy should be like second nature. Why? Because the chikou span cross is essentially the "chikou span confirmation" that savvy Ichimoku traders utilize to confirm chart sentiment before entering any trade. This confirmation comes in the form of the chikou span crossing through the price curve in the direction of the proposed trade. If it crosses through the price curve from the bottom up, then it is a bullish signal. If it crosses from the top down, then it is considered a bearish signal.
                                Thus, we already know the power of the chikou span cross via its use as a confirmation strategy. However, when used within some simple guidelines, the chikou span cross can be used as its own standalone trading strategy with very good success.
                                Like many other Ichimoku trading strategies, the chikou span cross strategy uses price's relationship to the kumo to categorize its signals into three (3) major classifications: strong, neutral and weak.

                                STRONG CHIKOU SPAN CROSS SIGNALA strong chikou span cross Buy signal takes place when a bullish cross takes place and current price is above the kumo A strong chikou span cross Sell signal takes place when a bearish cross takes place and current price is below the kumo. </pre>
                                NEUTRAL CHIKOU SPAN CROSS SIGNALA neutral chikou span cross Buy signal takes place when a bullish cross takes place and current price is within the kumo A neutral chikou span cross Sell signal takes place when a bearish cross takes place and current price is within the kumo. </pre>
                                WEAK CHIKOU SPAN CROSS SIGNALA weak chikou span cross Buy signal takes place when a bullish cross takes place and current price is below the kumo A weak chikou span cross Sell signal takes place when a bearish cross takes place and current price is above the kumo. </pre>The chart in Figure IX below provides several examples of the chikou span cross. Given the fact that the chikou span is a measure of closing price shifted 26 periods into the past, we must always keep in mind both the location of the chikou span in relation to the price curve (the "cross" itself) and the current candle and its relation to the kumo. Thus, Point A1 is the point where the chikou span crossed the price curve downward and Point A2 is the closing candle that initiated that bearish cross. However, since the candle at Point A2 was above the prevailing kumo at the point of the cross, this particular signal would be categorized as a "weak" bearish cross. A strong bullish cross can be seen in Points B1 and B2 since the chikou span crossed upward through the price curve and the closing candle at that point in time was above the prevailing kumo. Points C1 and C2 represent a weak bearish cross given that they transpired above the prevailing kumo.
                                FIGURE IX - Chikou Span Cross Classifications


                                Entry

                                The entry for the chikou span cross is relatively straightforward - the trader initiates a position in the direction of the chikou span cross after taking into consideration the cross's strength and other chart signals. For the highest probability of success, the trader will also look for the chikou span itself to be free of the kumo as the chikou span can often interact with the kumo much like the price curve.
                                Exit

                                The most traditional exit for a chikou span cross trade is generally signalled by a chikou span cross in the opposite direction of the trade, though other exit signals may be taken depending upon the trader's risk tolerance and profit goals.
                                Stop-Loss Placement

                                The chikou span strategy does not dictate use of any particular Ichimoku structure for stop-loss placement, like some other strategies do. Instead, the trader should consider their execution time frame and their money management rules and then look for the appropriate prevailing structure for setting their stop-loss.
                                Take Profit Targets

                                Take profit targetting for the chikou span cross strategy can be approached in one of two different ways. It can be approached from a day/swing trader perspective where take profit targets are set using key levels, or from a position trader perspective, where the trader does not set specific targets but rather waits for the current trend to be invalidated by a chikou span cross transpiring in the opposite direction of their trade.
                                Case Study

                                In the Daily chart in Figure X below for USD/CHF we can see a bullish chikou span cross at point A. However, while it is technically a strong cross, the chikou span is still below significant resistance provided by the two chikou span points at 1.2090. In addition, the tenkan sen and kijun sen are in a flat configuration which doesn't provide any additional confirmation. Thus we wait for a more convincing setup before entering Long. This is achieved five (5) days later at Point B1 when the chikou span moves back up through the price curve after a brief dip below. We wait for the daily candle to close and then enter long at 1.2164 at Point B2. Our confidence in this entry is increased by the bullish tenkan sen/kijun sen cross that has since transpired.
                                For our stop-loss, we consider the prevailing structures and decide to place it just below the kijun sen at 1.1956, since a cross below that point will not only have the chikou span executing a fresh bearish cross, but also have price executing a bearish kijun sen cross, both of which would invalidate our long position.
                                Once we place our entry and stop-loss orders, we wait for the trade to unfold. Depending upon our trading style, we could opt to trail our stop-loss along with the kijun sen to keep a tighter rein on risk management or we could utilize the more traditional method of waiting for a chikou span cross in the opposite direction of our trade. In this case, a chikou span cross in the opposite direction takes place just under two months later (Point C1) at 1.2619 (Point C2) and we close out our trade for a gain of over 450 pips. It is worth noting that, even though the chikou span cross on its own would be considered technically "weak" due to its location above the kumo, it is bolstered by a bearish tenkan sen/kijun sen cross to form a bearish three-line pattern. Alternatively, if we had chosen to use the kijun sen as our trailing stop in this trade, instead of waiting for a chikou span cross, we would have exited somewhere around the 1.2735 level, which would have netted us over 560 pips.
                                FIGURE X - Chikou Span Cross Case Study
                                اولین و کارآمد ترین و موثر ترین روش جهت ورود به بازار ، ورود در بالای خطوط حمایت و در زیر خطوط مقاومت می باشد. این اولین ، مهمترین و پر کاربرد ترین درسی است که یک تریدر باید بیاموزد.

                                نظر

                                پردازش ...
                                X